The Key Agricultural Equipment Dealership KPIs to Track in 2027
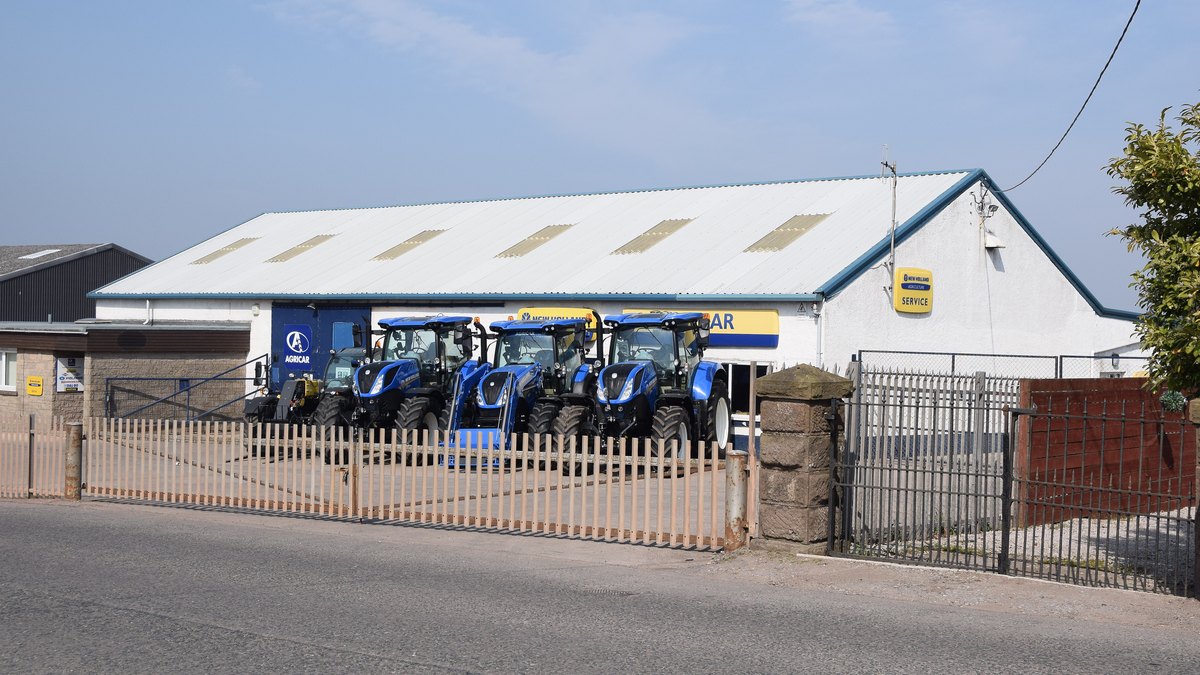
Track seven numbers: whole-goods unit sales (new tractors and combines), equipment gross margin, equipment inventory turns, aged and used-equipment inventory, parts and service gross profit, fixed-cost absorption, and floorplan cost. In a down cycle the first three show whether you are selling at a profit, the fourth shows whether old iron is eating your margin, and the last three show whether the shop pays for the building.
The benchmarks below are published, not guessed. Titan Machinery, the largest public U.S. equipment dealer group, reported fiscal 2026 (year ended January 31, 2026) equipment margin of 7.3%, parts margin of 30.9%, service margin of 61.5%, equipment inventory turns of 1.8 and company-wide absorption of 75.2%. The NAEDA Cost of Doing Business study put inventory turns at 2.52 to 2.82 for large dealers in 2024. Sales per salesperson, trade-in margin and parts fill rate have no public industry benchmark, and this page says so rather than inventing one.
The seven KPIs, in order
An agricultural equipment dealership earns money on whole goods (new and used machines), on parts, and on service, and it carries a heavy inventory that is financed on floorplan. The KPIs below cover each of those. If only a handful can go on the manager's screen, use these:
- Whole-goods unit sales. The volume that feeds everything else, tracked against the market (AEM publishes U.S. tractor and combine sales every month).
- Equipment gross margin. What is left on each machine after cost, including the discounts needed to move aged units.
- Equipment inventory turns. How many times a year the machine inventory sells through.
- Aged and used-equipment inventory. Units held longer than a year, and trade-ins that have not moved.
- Parts and service gross profit. The steadier profit pool, tracked in dollars, as a share of the total, and by margin.
- Fixed-cost absorption. The share of overhead covered by parts and service gross profit.
- Floorplan cost. Interest on the inventory you carry, which punishes slow turns.
Whole-goods unit sales and the market you sell into
Unit sales only mean something against the market. The Association of Equipment Manufacturers (AEM) reports U.S. and Canadian tractor and combine sales monthly, and the 2025 numbers were weak. Per AEM data reported by DAT, U.S. farm tractor sales for full-year 2025 were 195,857 units, nearly 10% below 2024, and combine sales were down more than 35% from the prior year.
- AEM, November 2025 (U.S., versus November 2024)Agricultural tractors down 19.6%, combines down 35.2% (reported by Oklahoma Farm Report).
- AEM, December 2025 (U.S., versus December 2024)Farm tractors down 14.8%, self-propelled combines down 4.3% (reported by DAT).
- Machines on hand at the start of December 2025Roughly 89,700 tractors and 845 combines (reported by DAT).
Titan Machinery's fiscal 2027 plan assumes the decline continues: its release models agriculture revenue down 15% to 20%, and its CFO expects North American industry volumes to fall 15% to 20%. A dealer who tracks its own units against the AEM trend knows whether it is gaining or losing share when the whole market is shrinking.
Equipment gross margin and inventory turns
Equipment margin is thin and moves with inventory pressure. Titan reported an equipment gross margin of 7.3% for fiscal 2026 against 6.7% a year earlier, on equipment revenue of $1,774,535 thousand. That compares with a parts margin of 30.9% and a service margin of 61.5%, which is why the aftermarket carries the profit when machine sales slow.
- Titan Machinery, fiscal 2026 (fiscal 2025), 10-KEquipment 7.3% (6.7%). Parts 30.9% (31.3%). Service 61.5% (62.9%). Total 15.8% (14.6%).
- Titan Machinery, equipment inventory turnover, 10-K1.8 times for fiscal 2026 compared with 1.6 times for fiscal 2025.
- NAEDA / Equipment Dealer Consulting, 2025 study (2024 business year)Inventory turns of 2.52 times for dealers with $200M to $600M volume and 2.82 times for dealers over $600M.
- Titan Machinery outlook for fiscal 2027Consolidated full-year equipment margin of approximately 8.4% versus 7.3% in fiscal 2026 (earnings call, March 19, 2026).
The turn figures are not strictly comparable. Titan counts its own equipment inventory and the NAEDA study uses its own definitions and dealer groups, so read each against its own prior year. The point of the KPI is the direction: Titan's total inventory fell $205.6 million to $903.1 million during fiscal 2026, and its floorplan interest expense fell from $34.7 million to $24.1 million.
Aged and used-equipment inventory
In an ag downturn, the most damaging number is not the average inventory but the oldest units. On Titan's fourth-quarter fiscal 2026 call, its CFO said equipment held longer than 12 months fell about 45% to $174 million in the second half of the year. Its CEO acknowledged that "additional work remains in certain used equipment." Titan's 10-K notes that its used equipment is primarily acquired through trade-ins, which is why trade-in values and used-equipment aging belong on the same screen.
The NAEDA study (2024 business year, reported by Farm Equipment on December 18, 2025) shows how much balance sheet is tied up: new inventory was 40.75% of total assets for the $200M to $600M dealers and 31.17% for dealers over $600M, and used inventory ranged from 9.95% to 25.97% of assets across the study's three categories.
Parts, service and fixed-cost absorption
Parts and service are the shock absorber. Titan's fiscal 2026 gross profit was $132,515 thousand from parts and $109,459 thousand from service, out of $382,556 thousand in total, and its CEO said parts and service generate "over half" of gross profit dollars. Titan's 10-K says its parts sales are "less sensitive to economic cycles than our equipment sales."
- Titan Machinery, company-wide absorption, fiscal 2026 (fiscal 2025)75.2% (75.0%), from the 10-K.
- NAEDA, parts aftermarket absorption (2024 business year)38.45% for dealers with $200M to $600M volume and 26.68% for dealers over $600M.
- NAEDA, service gross margin (2024 business year)67.38% for $200M to $600M dealers and 52.18% for dealers over $600M.
- NAEDA, parts and accessories gross margin (2024 business year)30.06% for $200M to $600M dealers and 26.98% for dealers over $600M.
Do not compare the 75.2% with the 38.45%. They are different definitions: Titan reports a company-wide rate, and the NAEDA study reports a parts-aftermarket rate. Pick one definition, write it down and trend it monthly. The parts and service margins are the easier comparison, and Titan's 30.9% parts margin sits close to the NAEDA 30.06% for mid-size dealers.
What no public source publishes
Several KPIs on most dealer scorecards have no public industry benchmark. None of the sources used here publishes an industry-wide figure for sales per salesperson, parts fill rate, service labor efficiency or recovery, or trade-in margin for agricultural equipment dealers. Manufacturer dealer standards and the paid NAEDA report may cover some of them, but they are not public, so this page does not quote any.
For those metrics, set your own baseline from the last twelve months and compare quarter to quarter. A made-up industry average would only give you a target nobody can verify.
How to use the numbers in 2027
First, put your own trend line ahead of any benchmark. The published figures show a wide spread between a public group and a survey of private dealers, and between dealer sizes, so a benchmark is a range, not a grade.
Second, watch margin and inventory together. Titan's own outlook says it expects "continued margin pressure, particularly in the first half" of its fiscal 2027 even after cutting inventory, because the aged units have to be sold. A dealer that discounts to clear iron without tracking aged inventory and floorplan cost can lift unit sales while losing margin.
Third, lean on the aftermarket. With whole-goods volumes under pressure, parts and service margin and absorption are the KPIs that keep the store covered. Review them monthly against the same month last year.
Questions people ask
What is the most important KPI for a farm equipment dealership?
No single number covers it, but equipment inventory turns paired with aged-inventory dollars is the best early warning. Titan Machinery reported equipment turns of 1.8 for fiscal 2026 and aged equipment of $174 million after a cut of about 45%.
What is a good gross margin on agricultural equipment?
Equipment margins are thin. Titan Machinery reported 7.3% for fiscal 2026 and expects approximately 8.4% for fiscal 2027. Parts margin was 30.9% and service margin 61.5% in fiscal 2026.
What is a normal inventory turn for an equipment dealer?
The NAEDA Cost of Doing Business study reported 2.52 times for dealers with $200M to $600M volume and 2.82 times for dealers over $600M for the 2024 business year. Titan reported 1.8 times for equipment in fiscal 2026.
What is fixed-cost absorption for an equipment dealer?
It is the share of fixed overhead covered by parts and service gross profit. Titan reported 75.2% company-wide for fiscal 2026. NAEDA reports a parts-aftermarket rate of 38.45% and 26.68% by dealer size, a different definition, so do not compare them directly.
Is there a public benchmark for sales per salesperson or parts fill rate?
Not in any public source used for this page. Set your own baseline and trend it.
Sources
- Titan Machinery Form 10-K for the fiscal year ended January 31, 2026 · margins by revenue line, equipment inventory turnover, absorption rate
- Titan Machinery fourth quarter and full year fiscal 2026 results (8-K exhibit 99.1) · inventory, floorplan, fiscal 2027 modeling assumptions
- MarketBeat on Yahoo Finance: Titan Machinery Q4 earnings call highlights (March 19, 2026) · aged equipment, parts and service share of gross profit, equipment margin outlook
- Farm Equipment: Sales Volume Increases, but Net Income Declines (NAEDA Cost of Doing Business Study) · inventory turns, parts and service margins, parts aftermarket absorption
- DAT: Ag equipment hits the brakes (AEM data, December 2025) · U.S. tractor and combine sales, full year 2025
- Oklahoma Farm Report: U.S. tractor and combine sales (AEM data, November 2025) · monthly U.S. tractor and combine sales change
Figures are as published for the periods named and will change with each new filing and survey. If anything here is out of date or inaccurate, use the contact page and it will be corrected. Photos: Wikimedia Commons, credited under each image.
Top photo: Bill Harrison / CC BY-SA 2.0 via Wikimedia Commons