The Most Important Auto Dealership KPIs to Track in 2027
Track seven numbers: gross profit per unit (new and used), F&I per retail unit, service and parts gross profit, SG&A as a percentage of gross profit, days supply (new and used), repair-order value and volume, and new-vehicle units per dealership. Together they show whether the store makes money on each sale, whether it keeps what it earns, and whether the shop carries its share of the cost of running the building.
The benchmarks below are published, not guesses. In 2025 AutoNation reported $2,564 of gross profit per new vehicle, $1,555 per used retail vehicle and $2,769 of finance and insurance per vehicle, with SG&A at 67.9% of gross profit. NADA Data put the average franchised dealership's service and parts sales at $9,687,942, and AutoNation's service and parts business produced 47.6% of its gross profit. One thing no public source gives is a single industry-wide figure for service absorption, so this page says so rather than inventing one.
The seven KPIs, ranked
A dealership has four profit centers (new, used, finance and insurance, and service and parts) and one big cost line (SG&A). The seven KPIs below cover all five. If you can only put a handful on the manager's screen, use these in this order:
- 1. Gross profit per unit, new and used. The first test of whether each deal earns its keep.
- 2. F&I gross profit per retail unit. The most controllable profit in the store.
- 3. Service and parts gross profit. The steadiest profit center, tracked as dollars, as a share of the total, and per repair order.
- 4. SG&A as a percentage of gross profit. The best single measure of how much of every gross dollar the store keeps.
- 5. Days supply, new and used. How long inventory sits, which drives floorplan cost and discounting.
- 6. Repair-order volume and value. How many cars the shop sees and what each one is worth.
- 7. Units per dealership. The volume that spreads the fixed cost.
Gross profit per unit: new and used
Gross profit per unit (GPU) is the profit left after the cost of the vehicle, divided by the vehicles sold. Track new and used separately, because they move for different reasons. New GPU follows supply and incentives. Used GPU follows your buying discipline at auction and on trade-ins.
- AutoNation, full year 2025 (2024 in brackets)New vehicle $2,564 ($3,045). Used vehicle retail $1,555 ($1,558).
- AutoNation, fourth quarter 2025 (fourth quarter 2024)New vehicle $2,398 ($2,969). Used vehicle retail $1,438 ($1,538).
- Group 1 Automotive, fourth quarter 2025 (consolidated, includes the U.K.)New vehicle $3,294, down 7.0%. Used vehicle retail $1,295, down 9.6%.
- Asbury Automotive Group, fourth quarter 2025Same store used retail GPU of $1,749, growth of 18%.
The spread between companies is wide, which is why the KPI is your own trend line first and a benchmark second. AutoNation's new GPU fell from $3,045 to $2,564 in one year while its new-vehicle unit sales rose, a reminder that volume and GPU can pull against each other. Watch both on the same screen.
NADA Data adds the volume context: the average franchised dealership sold 955 new vehicles in 2025 at an average retail selling price of $48,205 (935 vehicles and $47,652 in 2024).
F&I per retail unit
Finance and insurance gross profit per retail unit is calculated over every vehicle retailed, new and used, not only the ones financed. It is the KPI most under the store's control, because it depends on process, menu selling and product penetration rather than on what the market does.
- AutoNation, full year 2025 (2024)$2,769 ($2,612). Fourth quarter 2025: $2,891 ($2,686).
- Group 1 Automotive, fourth quarter 2025$2,079 per retail unit, up 4.4%. Full year 2025: $2,036.
- Asbury Automotive Group, fourth quarter 2025$2,334 per vehicle retailed.
AutoNation's finance and insurance business was 29.6% of its total gross profit in 2025, second only to parts and service. Track F&I per unit alongside the number of products sold per vehicle and the financing rate, so you can tell a pricing change from a penetration change.
Service and parts: the fixed-ops KPIs
Fixed operations is the part of the dealership that does not depend on how many cars were sold this month. Track it as dollars of gross profit, as a share of the total, and per repair order.
- Share of gross. Parts and service was 47.6% of AutoNation's total gross profit in 2025 and 17.5% of its revenue. Across all franchised dealers NADA puts service and parts at 13.3% of total sales dollars, against 54.9% for new vehicles and 31.8% for used.
- Gross margin. Group 1 reported a parts and service gross margin of 56.3% in the fourth quarter of 2025, with parts and service gross profit of $394.2 million, up 6.3%. Asbury reported parts and service gross profit up 13% in the same quarter.
- Repair-order value and volume. NADA Data for 2025: 16,252 repair orders per average dealership, $494 of service and parts sales per customer repair order and $551 per warranty repair order.
- Capacity and rate. The average dealership had 16 technicians (including the body shop) and an average customer mechanical labor rate of $186. Parts sales ran at $1.43 per dollar of service labor sales.
At the national scale, dealers wrote more than 276 million repair orders and sold more than $164 billion of service and parts in 2025, according to NADA. The average dealership sold $9,687,942.
SG&A as a percentage of gross profit
This is the KPI that tells you how much of each gross dollar survives the expense lines. It is the ratio public dealer groups lead with, and it moved up in the fourth quarter of 2025 as gross profit per unit fell.
- AutoNation, full year 2025 (2024)67.9% (68.2%). Fourth quarter 2025: 68.8%, against 67.1% a year earlier.
- Group 1 Automotive, fourth quarter 202571.7%, up 187 basis points. Full year 2025: 70.3%.
- Asbury Automotive Group, fourth quarter 202566.7%, or 65.3% on its adjusted basis.
Read the direction, not just the level. When GPU shrinks, SG&A as a percentage of gross rises even if spending is flat, which is what AutoNation's fourth quarter shows: gross profit per new vehicle fell and the ratio moved from 67.1% to 68.8%.
Days supply and inventory
Days supply measures how long current inventory would last at the recent selling rate. It sets your floorplan cost and how hard you will have to discount. Be careful about the definition, because the sources do not calculate it the same way.
- NADA Data, end of 2025. New-vehicle inventory of 2,577,974 units, with a days' supply of 47 for domestic brands and 41 for imports.
- AutoNation, December 31, 2025. New days supply of 45 days on the industry standard of selling days (39 a year earlier) and used days supply of 38 days (37 a year earlier).
- Cox Automotive, January 1, 2026. About 2.77 million new vehicles, a 76-day supply, down from 92 days in early December, as reported by CBT News from Cox Automotive vAuto data.
The different results are a definitions problem as much as a market one, so pick one method and track your own trend with it. NADA also reported that new light-vehicle inventory ended 2025 at 2.6 million units on the ground and in transit, down 7.6% year-over-year.
How to use the numbers in 2027
Put the seven KPIs on one page per department and review them weekly. Compare each one with itself first: this month against last month and against the same month a year ago. Then use the published figures above as outside reference points, not as targets. The public groups differ in brand mix, region and the way they define their ratios, and a rural domestic store should not expect a premium-luxury store's per-unit figures.
Two habits make the KPIs work. First, read them in pairs: GPU with units, F&I with penetration, SG&A with gross. Second, write down the definition once. A KPI that changes its meaning between months is worse than no KPI.
One gap to plan for: customer satisfaction and retention scores belong on the list, but none of the public sources used here publishes an industry benchmark for them, so set them from your own manufacturer and survey data.
Questions people ask
What is the single most important KPI for a car dealership?
There is no single one, but SG&A as a percentage of gross profit is the best summary. AutoNation reported 67.9% for 2025, Group 1 reported 70.3% and Asbury reported 66.7% for the fourth quarter. It shows how much of each gross dollar is left after expenses.
What is a good F&I gross profit per unit?
In the fourth quarter of 2025 Group 1 reported $2,079 per retail unit, Asbury $2,334 per vehicle retailed and AutoNation $2,891. For the full year AutoNation reported $2,769. Compare with your own trend and brand mix.
What is a normal days supply for new vehicles?
It depends on the method. NADA reported 47 days for domestic and 41 days for import brands at the end of 2025, AutoNation reported 45 days at December 31, 2025, and Cox Automotive reported 76 days on January 1, 2026.
What is service absorption and what is the benchmark?
Absorption is the share of a dealership's fixed expenses covered by service and parts gross profit. None of the public sources used here publishes an industry-wide 2025 figure, so calculate it for your own store.
How much does the average dealership make from service and parts?
NADA Data reported average service and parts sales of $9,687,942 per franchised dealership in 2025, with 16,252 repair orders and $494 of sales per customer repair order.
Sources
- NADA Data 2025: Annual Financial Profile of America's Franchised New-Car Dealerships · dealer counts, sales mix, days' supply, service and parts profile
- AutoNation fourth quarter and full year 2025 earnings release (8-K) · gross profit per vehicle, F&I, SG&A ratio, days supply
- Group 1 Automotive fourth quarter and full year 2025 results · per-unit gross profit, F&I, parts and service margin, SG&A ratio
- Asbury Automotive Group fourth quarter 2025 results (8-K) · F&I per vehicle, SG&A ratio, used GPU
- CBT News: New-vehicle inventory tightens as auto industry enters 2026 (Cox Automotive data) · inventory and days supply at the start of 2026
Figures are as published for the periods named and will change with each new quarterly release. If anything here is out of date or inaccurate, use the contact page and it will be corrected. Photos: Wikimedia Commons, credited under each image.
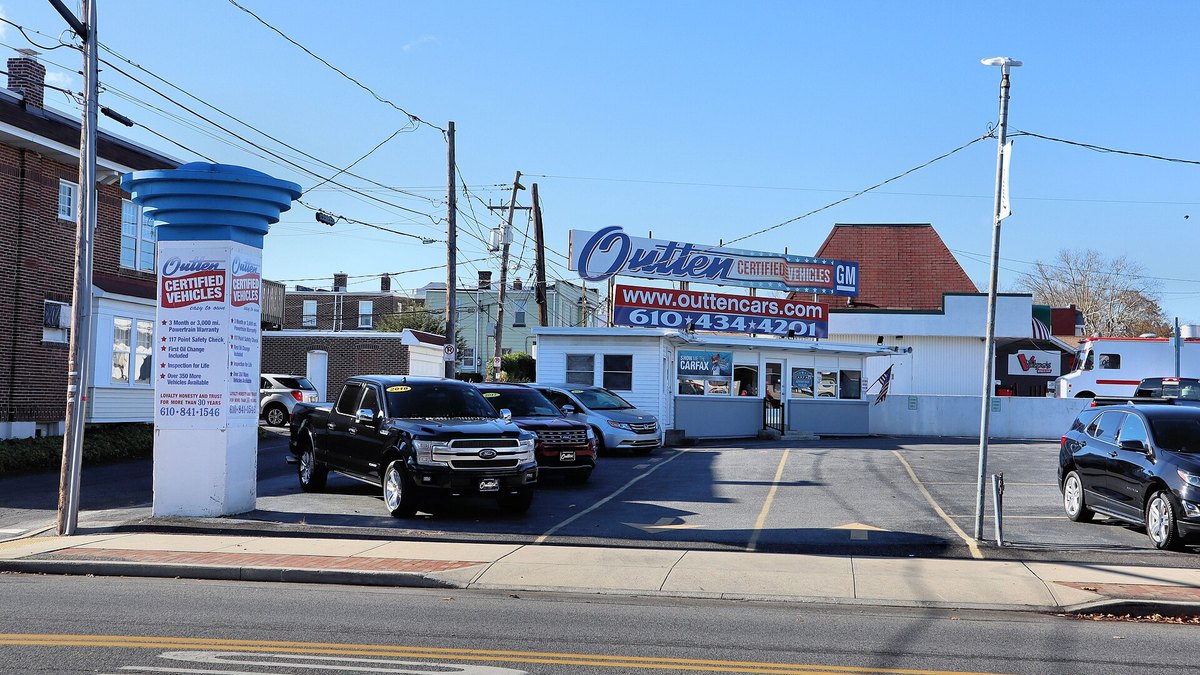
Top photo: Atwngirl / CC BY-SA 4.0 via Wikimedia Commons