Top 10 Airline Revenue Per Available Seat Mile Metrics in 2027
By Kory White · Updated Nov 2026 · 4 min read
Direct answer
Delta Air Lines leads the nine US-dollar reporters on total revenue per available seat mile for the third quarter of 2026 at 22.18 cents adjusted (25.46 cents GAAP, which includes refinery sales), followed by American at 20.25 cents and United at 20.19 cents. Air Canada reported 23.4 Canadian cents and is listed last, outside the US-dollar order. Figures come from each airline's own release or filing.
Adjusted TRASM of 22.18 cents versus 19.22 cents, up 15%, after removing third-party refinery sales of 3.28 cents (1.87 cents a year earlier), for the three months ended September 30, 2026
Anyone who wants the highest US-dollar unit revenue without refinery sales
Operating revenue per ASM (TRASM) of 23.4 cents versus 20.4 cents, up 14.4%, for the third quarter of 2026
Readers comparing a Canadian network carrier with the US carriers on its own terms
Pick by what you want
Best overall
Delta Air Lines
Best for growth
Frontier Airlines
Best for big-three comparison
United Airlines
Best on flat capacity
Southwest Airlines
Best outside the US-dollar order
Air Canada
The ranking
1
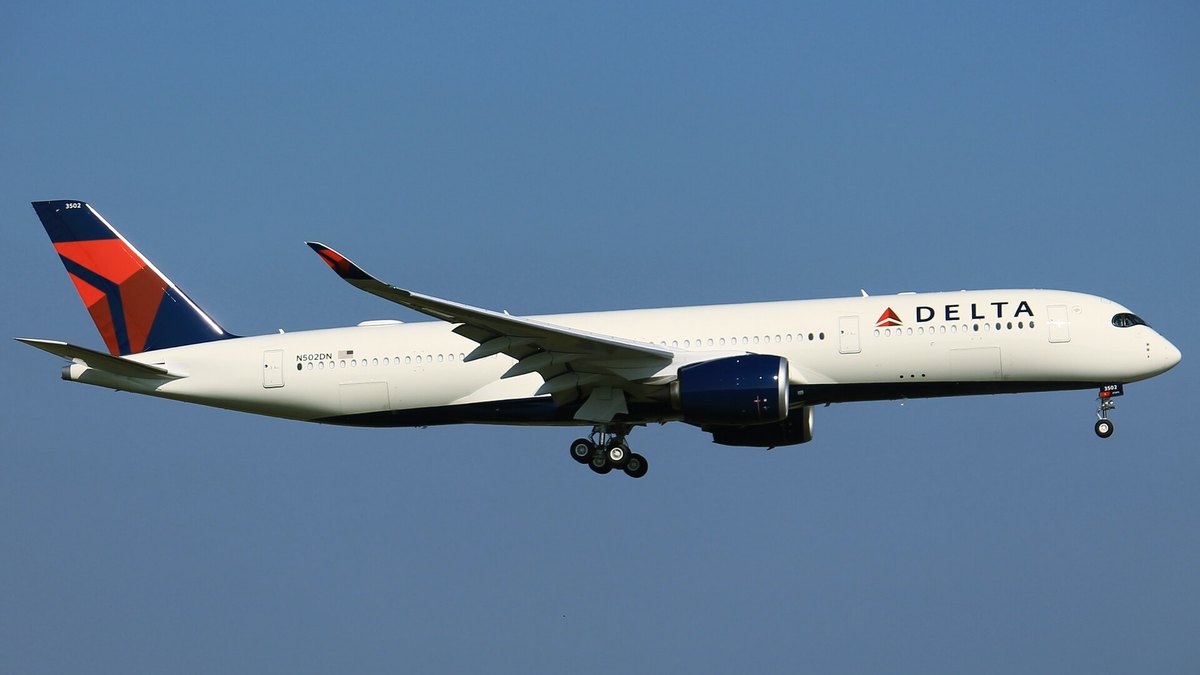
Delta Air Lines
Photo: formulanone from Huntsville, United States / CC BY-SA 2.0 via Wikimedia Commons
Answrs VerdictHighest adjusted TRASM; the GAAP figure is shown beside it.
Total unit revenue, Q3 2026: Adjusted TRASM of 22.18 cents versus 19.22 cents, up 15%, after removing third-party refinery sales of 3.28 cents (1.87 cents a year earlier), for the three months ended September 30, 2026GAAP TRASM, including refinery sales: Total revenue per available seat mile (TRASM) of 25.46 cents versus 21.09 cents, up 21%Passenger unit revenue (PRASM): 19.59 cents versus 17.08 cents, up 15%Capacity and load factor: Available seat miles of 79,288 million versus 79,054 million; passenger load factor of 86% in both quarters
Delta reported adjusted TRASM of 22.18 cents in the September 2026 quarter, up 15%, after removing third-party refinery sales. GAAP TRASM was 25.46 cents, up 21%, and PRASM was 19.59 cents.
Go ifAnyone who wants the highest US-dollar unit revenue without refinery sales
Skip ifYou want the GAAP figure of 25.46 cents, which includes refinery sales
Why #1 over #2: Its 22.18 cents is above American's 20.25 cents, with refinery sales excluded.
2
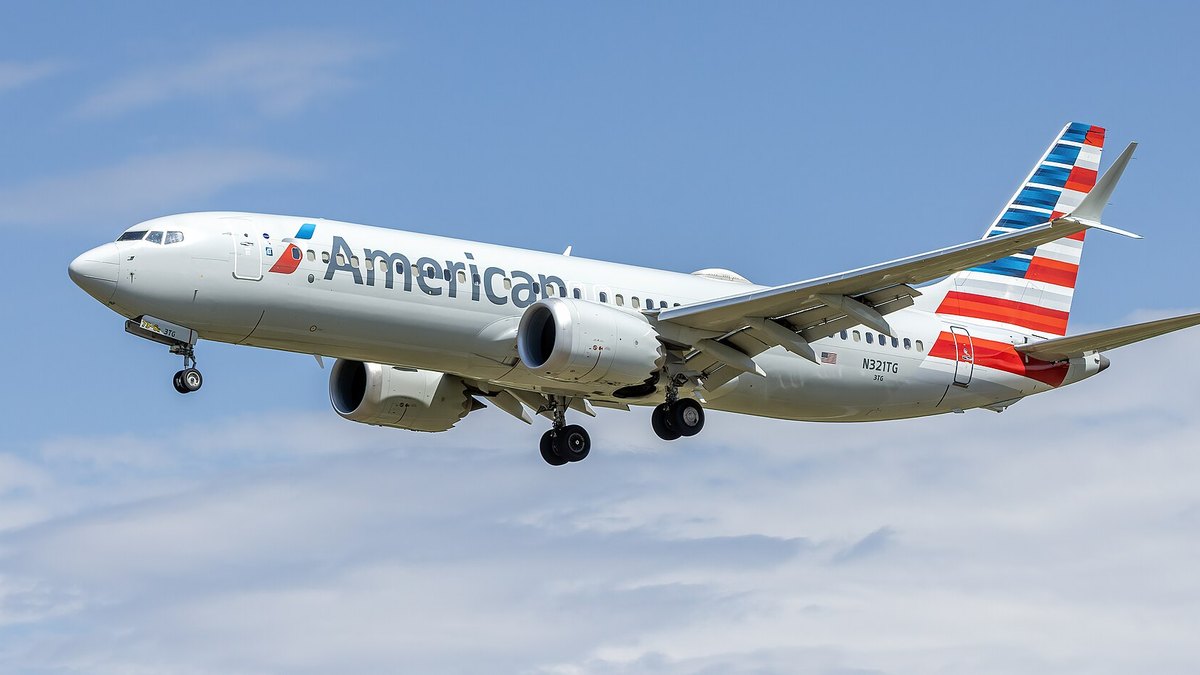
American Airlines
Photo: Acroterion / CC BY-SA 4.0 via Wikimedia Commons
Answrs VerdictJust ahead of United on reported TRASM.
Total unit revenue, Q3 2026: TRASM of 20.25 cents versus 17.69 cents, up 14.5%, in the third quarter of 2026Passenger unit revenue (PRASM): 18.47 cents versus 16.11 cents, up 14.6%Yield: 22.15 cents versus 18.73 cents, up 18.3%Capacity and load factor: ASMs of 80,680 million versus 77,400 million, up 4.2%; passenger load factor of 83.4% versus 86.0%
American reported TRASM of 20.25 cents, up 14.5%, on ASMs of 80,680 million. Passenger load factor was 83.4% versus 86.0% a year earlier.
Go ifComparing the largest US network carriers by unit revenue
Skip ifYou want the carrier with the smallest capacity growth
Why #2 over #3: Its 20.25 cents edges United's 20.19 cents.
3
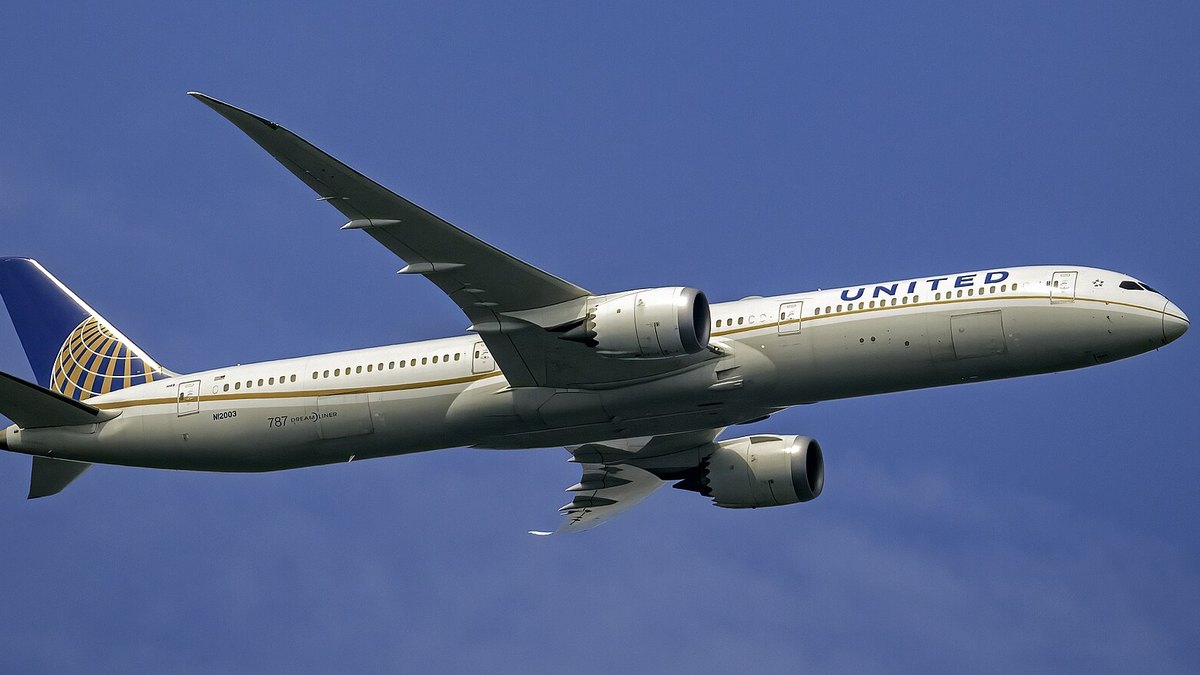
United Airlines
Photo: Acroterion / CC BY-SA 4.0 via Wikimedia Commons
Answrs VerdictFastest growth of the big three at 15.9%, a hair behind American on level.
Total unit revenue, Q3 2026: TRASM of 20.19 cents versus 17.42 cents, up 15.9%, for the three months ended September 30, 2026Passenger unit revenue (PRASM): 18.34 cents versus 15.80 cents, up 16.1%Revenue and capacity: Total operating revenue of $17.9 billion, up 17.4%, on capacity up 1.3%Yield and load factor: Average yield of 21.86 cents versus 18.73 cents, up 16.8%; consolidated passenger load factor of 83.9% versus 84.4%
United reported TRASM of 20.19 cents, up 15.9%, and PRASM of 18.34 cents, up 16.1%. Total operating revenue was $17.9 billion, up 17.4%, on capacity up 1.3%.
Go ifReaders who want the fastest TRASM growth among the three largest US carriers
Skip ifYou rank strictly by level; American reports 20.25 cents versus United 20.19 cents
Why #3 over #4: Its 20.19 cents is above Southwest's 18.55 cents.
4
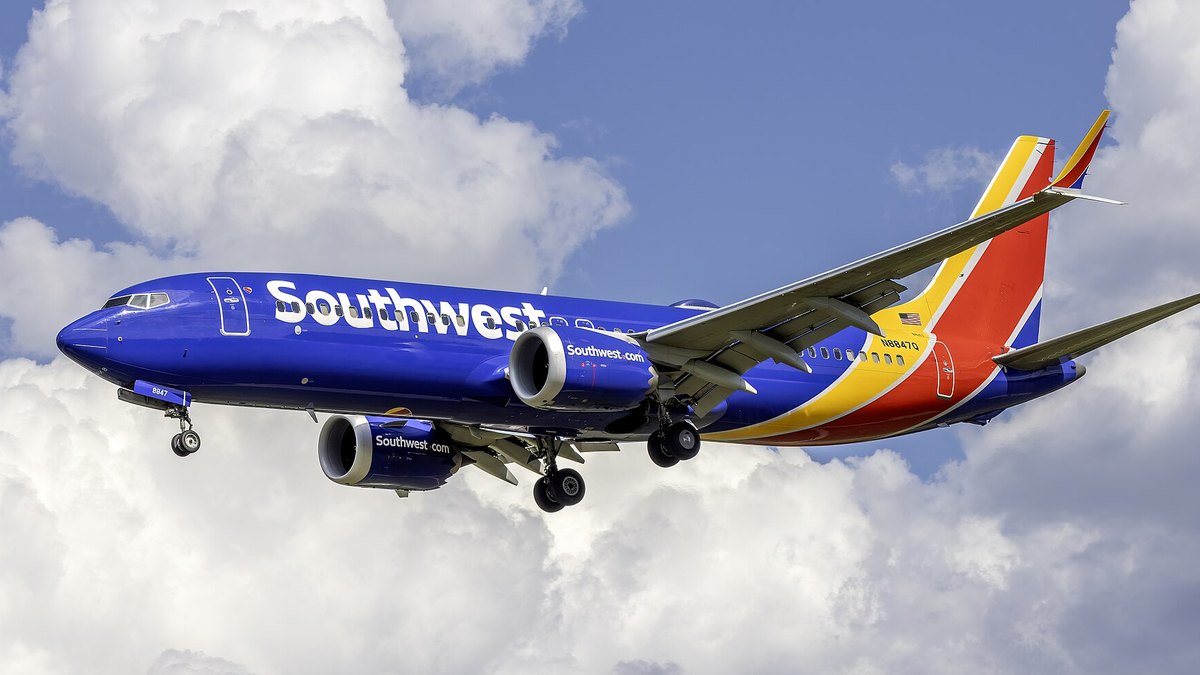
Southwest Airlines
Photo: Acroterion / CC BY-SA 4.0 via Wikimedia Commons
Answrs VerdictGrowth of 21.6% on slightly less capacity, from a lower base.
Total unit revenue, Q3 2026: Operating revenue per ASM (RASM) of 18.55 cents versus 15.25 cents, up 21.6%, an all-time Company record for a third quarterPassenger unit revenue (PRASM): 17.08 cents versus 13.85 cents, up 23.3%Yield: 21.41 cents versus 17.36 cents, up 23.3%Capacity and load factor: ASMs of 45,393 million versus 45,567 million, down 0.4%; load factor of 79.8% in both quarters
Southwest reported RASM of 18.55 cents, up 21.6%, an all-time Company record for a third quarter, on ASMs down 0.4% to 45,393 million.
Go ifReaders who want to see unit revenue growth on flat capacity
Skip ifYou want the highest absolute figure; three carriers report more
Why #4 over #5: Its 18.55 cents is above Alaska's 17.21 cents.
5
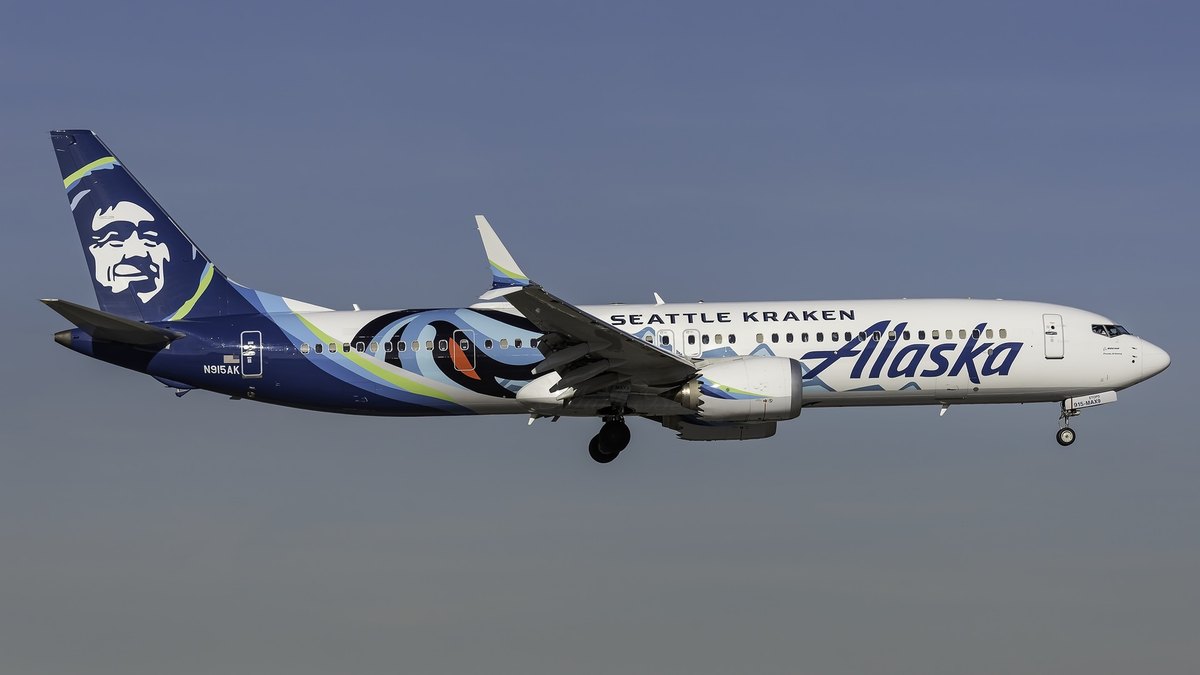
Alaska Airlines
Photo: Mark Bess / CC BY-SA 2.0 via Wikimedia Commons
Answrs VerdictMet its own guidance; mid-pack on level.
Total unit revenue, Q3 2026: Alaska Air Group RASM of 17.21 cents versus 15.41 cents, up 11.7%, in the third quarter of 2026Passenger unit revenue (PRASM): 15.52 cents versus 14.00 cents, up 10.9%Capacity and load factor: ASMs of 25,031 million versus 24,447 million, up 2.4%; load factor of 82.8% versus 84.8%Guidance versus actual: Prior expectation was RASM up low double digits; actual RASM was up 11.7%
Alaska Air Group reported RASM of 17.21 cents, up 11.7%, on capacity up 2.4%. Load factor fell to 82.8% from 84.8%.
Go ifComparing a West Coast network carrier that now includes Hawaiian
Skip ifYou need Alaska Airlines alone; the figure is Alaska Air Group consolidated
Why #5 over #6: Its 17.21 cents is above JetBlue's 16.28 cents.
6
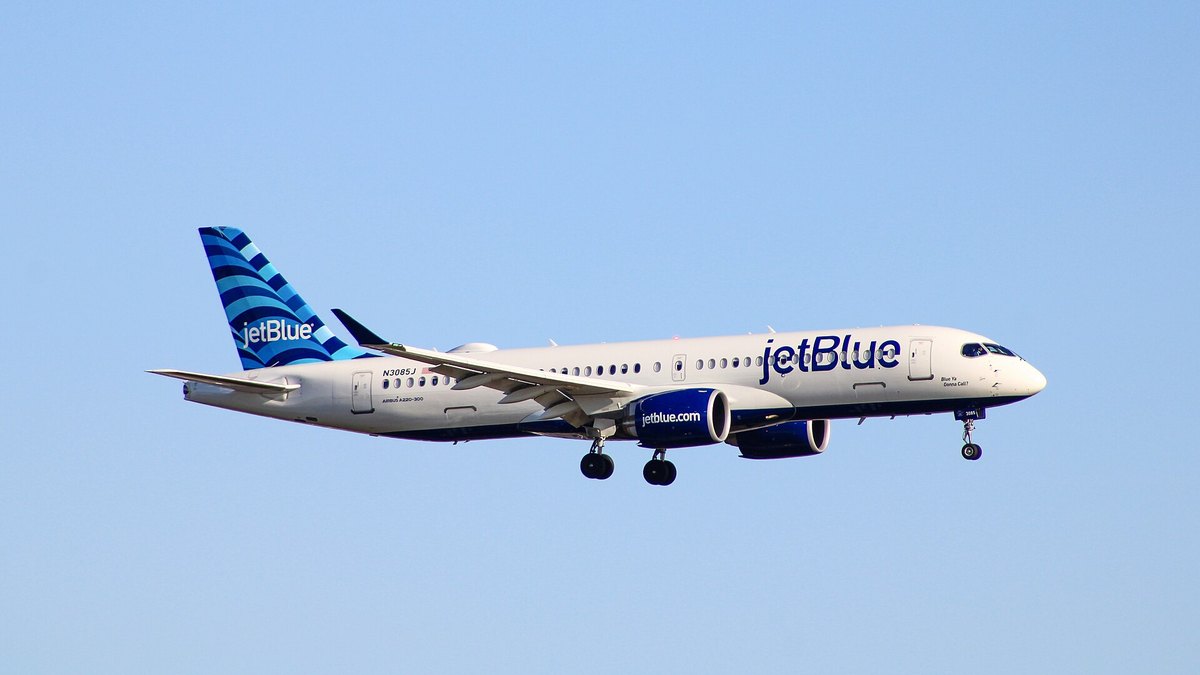
JetBlue Airways
Photo: Matthew Groh / CC BY-SA 4.0 via Wikimedia Commons
Answrs VerdictRASM beat initial expectations by a wide margin.
Total unit revenue, Q3 2026: Operating revenue per ASM (RASM) of 16.28 cents versus 13.75 cents, up 18.4%, for the third quarter of 2026Passenger unit revenue: 15.06 cents versus 12.65 cents, up 19.1%Capacity and load factor: ASMs of 17,268 million versus 16,884 million, up 2.3%; load factor of 83.6% versus 85.1%Drivers named: Higher yields, supported by improved revenue management technology, drove the majority of third-quarter revenue outperformance
JetBlue reported RASM of 16.28 cents, up 18.4%, and said higher yields supported by improved revenue management technology drove most of the revenue outperformance.
Go ifReaders tracking a turnaround carrier whose unit revenue beat its guidance
Skip ifYou want a profitable quarter; JetBlue reported an operating loss
Why #6 over #7: Its 16.28 cents is above Allegiant's 14.18 cents.
7
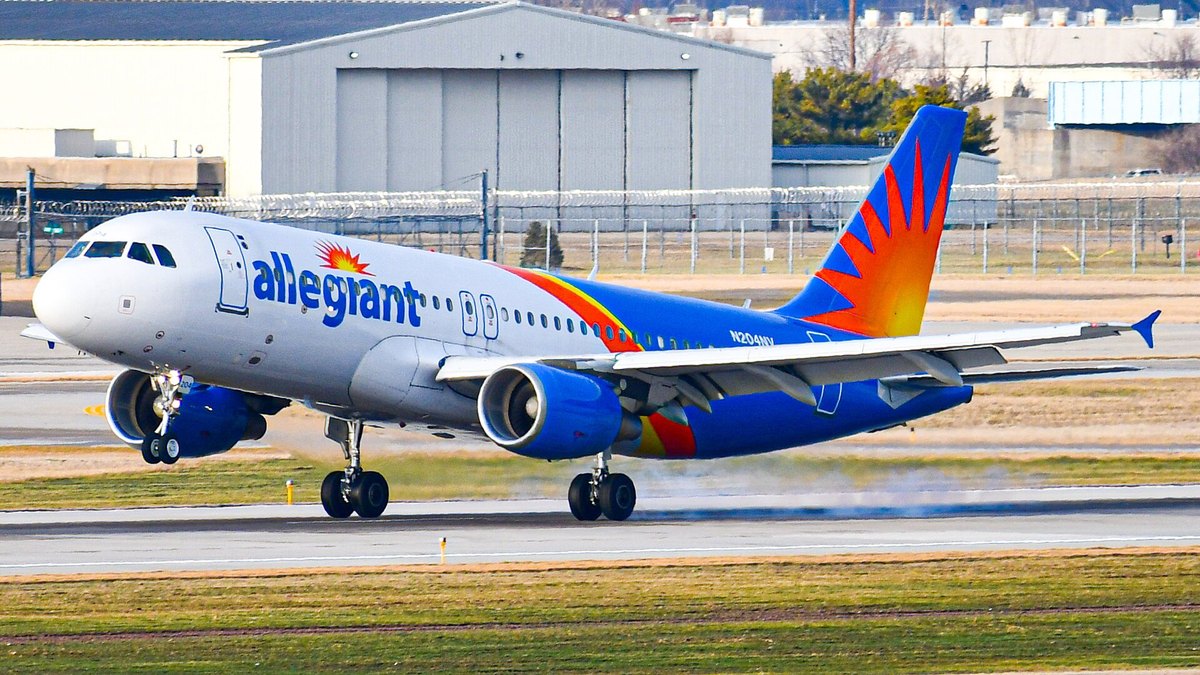
Allegiant Air
Photo: AVA Navigate / CC BY-SA 4.0 via Wikimedia Commons
Answrs VerdictA record quarter, but two growth rates apply.
Total unit revenue, Q3 2026: Scheduled service TRASM of 14.18 cents versus 11.19 cents, up 26.7%, a record third quarterPro forma comparison: On a pro forma basis including Sun Country, TRASM of 14.18 cents versus 11.05 cents, up 28.3%, on 5.7% less scheduled service capacityLoad factor: Scheduled service load factor of 86.7% versus 84.3%Sun Country: Sun Country results are reflected only from the May 13, 2026 close of the acquisition, so the reported figures mix companies
Allegiant reported scheduled service TRASM of 14.18 cents, up 26.7%, or up 28.3% on a pro forma basis including Sun Country. The acquisition closed May 13, 2026.
Go ifLeisure-carrier benchmarking, with the merger effect disclosed
Skip ifYou need a like-for-like figure; the reported and pro forma growth rates differ
Why #7 over #8: Its 14.18 cents is above Frontier's 11.87 cents.
8
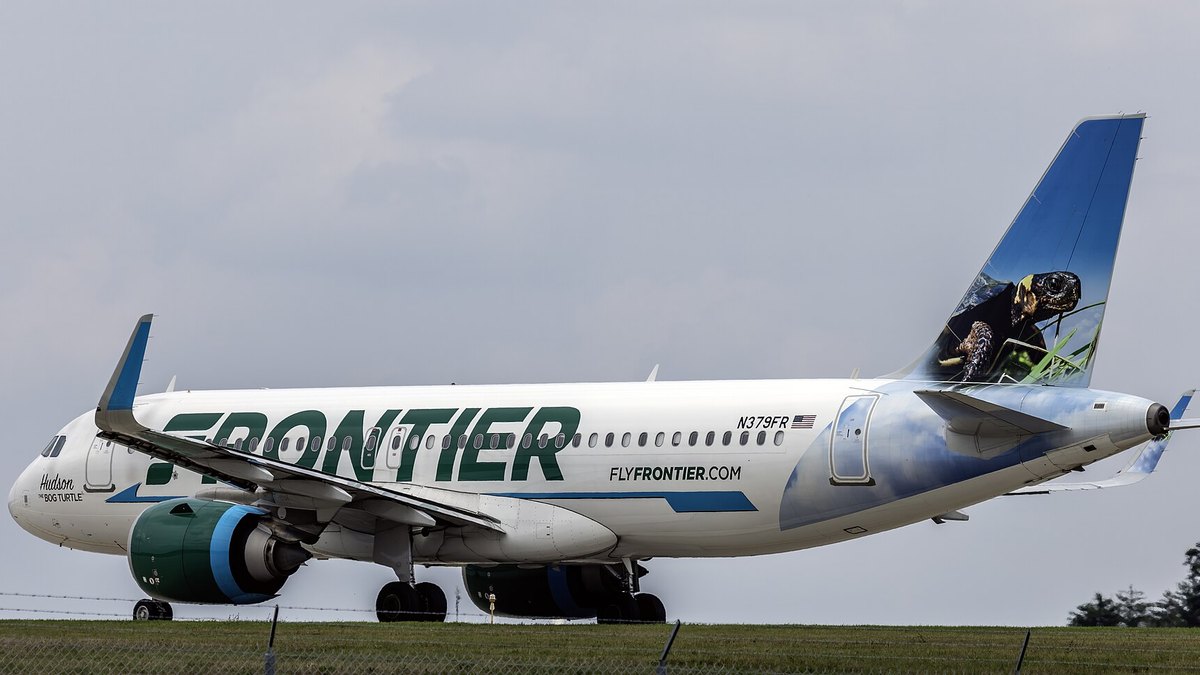
Frontier Airlines
Photo: Acroterion / CC BY-SA 4.0 via Wikimedia Commons
Answrs VerdictFastest reported growth of the ten airlines, from a low base.
Total unit revenue, Q3 2026: Revenue per available seat mile (RASM) of 11.87 cents versus 9.14 cents, up 30%Stage-length adjusted: RASM adjusted to 1,000 miles of 11.21 cents versus 8.76 cents, up 28%Revenue and capacity: Total operating revenues of $1,355 million versus $886 million; ASMs of 11,419 million versus 9,689 million, up 18%Nine months: RASM of 11.22 cents as reported (11.44 cents adjusted) versus 9.10 cents, up 23%
Frontier reported RASM of 11.87 cents, up 30%, on ASMs up 18% to 11,419 million. Stage-length adjusted RASM was 11.21 cents.
Go ifComparing ultra-low-cost carriers on unit revenue
Skip ifYou want the highest level; Frontier reports the second-lowest of the nine US-dollar carriers
Why #8 over #9: Its 11.87 cents is above Volaris's 10.31 cents.
9
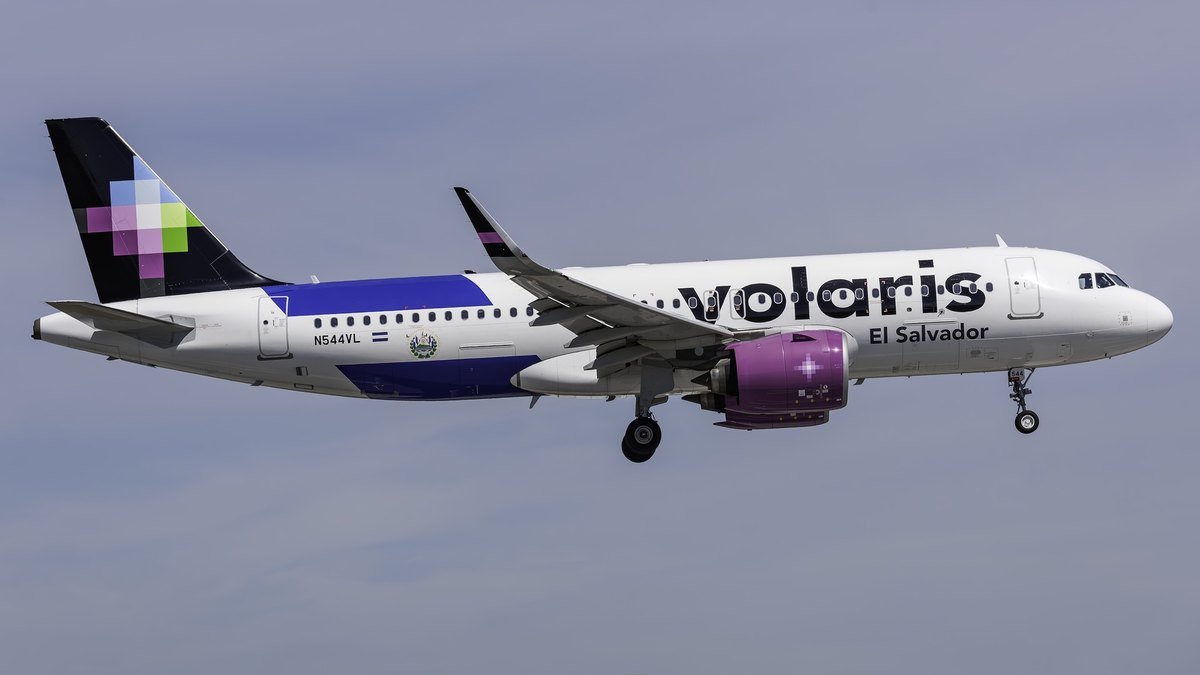
Volaris
Photo: Mark Bess / CC BY-SA 2.0 via Wikimedia Commons
Answrs VerdictLowest US-dollar level, with 19.2% growth.
Total unit revenue, Q3 2026: TRASM of 10.31 cents versus 8.65 cents, up 19.2%, in the third quarter of 2026First double-digit TRASM: The CEO said Volaris achieved double-digit TRASM for the first time in its history, with quarterly operating revenues crossing the US$1 billion markRevenue and capacity: Total operating revenues of $1,038 million versus $784 million, up 32.4%; ASMs of 10,071 million versus 9,067 million, up 11.1%Load factor: Scheduled load factor of 85.7% versus 84.4%
Volaris reported TRASM of 10.31 cents, up 19.2%, with total operating revenues of $1,038 million. Its CEO called it the first double-digit TRASM in company history.
Go ifBenchmarking a Mexican ultra-low-cost carrier reporting in US dollars
Skip ifYou want a US carrier; Volaris is Mexican
Why #9 over #10: It is the lowest of the nine US-dollar figures, ranked last in the order on level alone.
10
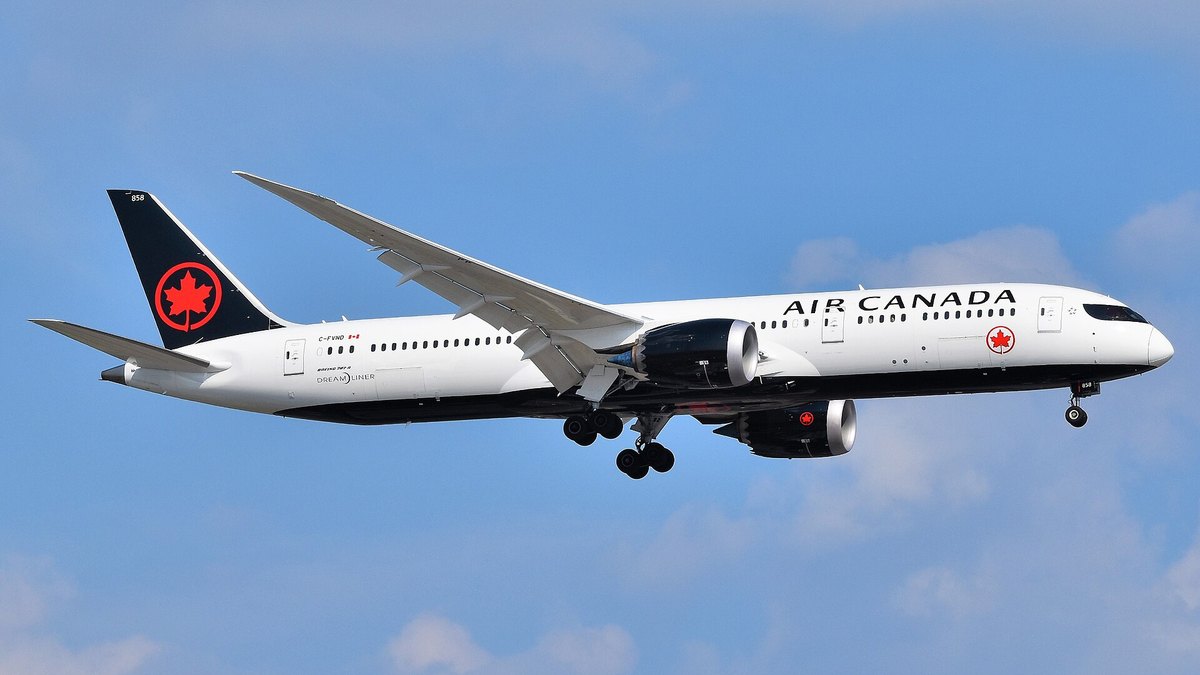
Air Canada
Photo: Adam Moreira (AEMoreira042281) / CC BY-SA 4.0 via Wikimedia Commons
Answrs VerdictListed last because it reports in Canadian dollars.
Total unit revenue, Q3 2026: Operating revenue per ASM (TRASM) of 23.4 cents versus 20.4 cents, up 14.4%, for the third quarter of 2026Currency: Air Canada reports in Canadian dollars; the cents are Canadian and this page does not convert themPassenger unit revenue (PRASM): 21.2 cents versus 18.5 cents, up 14.4%Capacity and load factor: ASMs of 29,893 million versus 28,282 million, up 5.7%; passenger load factor of 89.1% versus 86.5%
Air Canada reported TRASM of 23.4 Canadian cents in the third quarter, up 14.4%, with passenger load factor of 89.1%. It is listed outside the US-dollar order and is not converted.
Go ifReaders comparing a Canadian network carrier with the US carriers on its own terms
Skip ifYou need a US-dollar figure; this one is in Canadian cents, not converted and outside the ranked order
How we ranked these
We ranked nine airlines that report in US dollars by the total unit revenue each reported for the third quarter of 2026 (three months ended September 30), highest first, from the airline's own earnings release or SEC filing. Delta is ranked on its adjusted TRASM of 22.18 cents, which removes third-party refinery sales that are not airline revenue; its GAAP 25.46 cents is shown beside it. Volaris reports in US dollars, so it is in the order. Air Canada reports in Canadian dollars, so it is listed tenth as a separate entry outside the US-dollar order, unconverted. Allegiant's reported figures include Sun Country only from May 13, 2026, and Alaska's figure is for Alaska Air Group. We kept eight airlines from an earlier version of this ranking (Southwest, Delta, United, American, Alaska, JetBlue, Frontier and Allegiant). Spirit and Avelo were replaced with Volaris and Air Canada because no third quarter 2026 release could be read for them. We did not compute any ratio or convert any currency. Facts are taken from each maker's own published information; check the official site before you buy.
Questions people ask
What is RASM or TRASM?
Revenue per available seat mile is revenue divided by available seat miles. American defines TRASM as total revenues divided by ASMs, and Southwest calls operating revenues per ASM "RASM".
Which airline had the highest unit revenue in Q3 2026?
Among US-dollar reporters, Delta ranks first on adjusted TRASM of 22.18 cents; its GAAP TRASM of 25.46 cents includes third-party refinery sales of 3.28 cents.
Which airline grew unit revenue fastest?
Frontier reported RASM up 30% to 11.87 cents, and Southwest reported RASM up 21.6% to 18.55 cents.
Why is Air Canada listed last?
Air Canada reported TRASM of 23.4 cents in Canadian dollars. Because the other nine report in US dollars and this page does not convert currencies, it sits outside the ranked order.
Total unit revenue, Q3 2026, US cents per available seat mile (US-dollar reporters only; Air Canada excluded) at a glance
Volaris unit revenue, Q3 202610.31 cents
Frontier Airlines unit revenue, Q3 202611.87 cents
Allegiant Air (scheduled service) unit revenue, Q3 202614.18 cents
JetBlue Airways unit revenue, Q3 202616.28 cents
Alaska Air Group unit revenue, Q3 202617.21 cents
Southwest Airlines unit revenue, Q3 202618.55 cents
United Airlines unit revenue, Q3 202620.19 cents
American Airlines unit revenue, Q3 202620.25 cents
Delta Air Lines (adjusted TRASM) unit revenue, Q3 202622.18 cents
Total unit revenue, Q3 2026, US cents per available seat mile (US-dollar reporters only; Air Canada excluded), as published by each maker. Picks without a published figure are left off.