Comparable sales growth is the top fast food chain revenue KPI in 2027, followed by system-wide sales and traffic versus check. McDonald’s reported Q3 2026 global comparable sales up 1.5% with the U.S. down 0.2%, Restaurant Brands 3.8% and Domino’s U.S. 0.3%. Chipotle reported digital sales of 38.8% of revenue and Taco Bell led the 2025 drive-thru study at 4:16. Where no figure is published, this page says so.
McDonald’s: comparable sales are sales at restaurants in operation at least thirteen months, owned or franchised, and are driven by changes in guest counts and average check
Yum! Brands: digital system sales include all transactions at system restaurants where consumers use an ordering interaction primarily facilitated by automated technology
Chipotle: average restaurant sales are the average trailing 12-month food and beverage revenue for company-owned restaurants open at least 12 full calendar months
McDonald’s: systemwide sales to loyalty members are all sales to customers who self-identify as a loyalty member, measured across 70 markets with loyalty programs
Intouch Insight: service time is the amount of time from the shopper placing the order until exiting the drive-thru with the food
Pick by what you want
Best overall
Fast Food Comparable Sales Growth
Best for scale
Fast Food System-Wide Sales
Best for digital
Fast Food Digital Sales Mix
Best for profitability
Fast Food Restaurant-Level Margin
Best for service speed
Fast Food Drive-Thru Service Time
The ranking
1
Fast Food Comparable Sales Growth
Photo: Candeadly / CC BY 4.0 via Wikimedia Commons
Answrs Verdict
Definition: McDonald’s: comparable sales are sales at restaurants in operation at least thirteen months, owned or franchised, and are driven by changes in guest counts and average checkMcDonald’s, Q3 2026: Global comparable sales up 1.5%: U.S. down 0.2%, International Operated Markets up 1.4%, International Developmental Licensed Markets up 4.2%Restaurant Brands, Q3 2026: Global comparable sales of 3.8%, including 8.4% at Burger King U.S. and 3.9% at InternationalDomino’s, Q3 2026: U.S. same store sales growth of 0.3% and international same store sales growth of 0.2%, excluding foreign currencyWendy’s, Q2 2026: U.S. same-restaurant sales down 7.0% and international down 2.3% in the quarter ended June 28, 2026
Comparable sales strip out new openings and show whether existing restaurants are growing. McDonald’s reported global comparable sales up 1.5% in Q3 2026, Restaurant Brands 3.8% including 8.4% at Burger King U.S., and Domino’s U.S. same store sales up 0.3%. Wendy’s reported U.S. same-restaurant sales down 7.0% in Q2 2026.
Go if
Skip if
Why #1 over #2: It is the one number that separates real demand from simply opening more restaurants.
2
Fast Food System-Wide Sales
Photo: Andre Carrotflower / CC BY-SA 4.0 via Wikimedia Commons
Answrs Verdict
Definition: McDonald’s: Systemwide sales include sales at all restaurants, whether owned and operated by the company or by franchiseesMcDonald’s, Q3 2026: Global Systemwide sales increased 4% to over $38 billion for the quarterRestaurant Brands, Q3 2026: System-wide Sales of $12,972 million, with growth of 6.2% on a constant currency basisDomino’s, Q3 2026: Global retail sales of $4,840.4 million versus $4,696.2 million, with growth of 3.2% excluding foreign currencyQSR 50, 2025 U.S. sales: McDonald’s $55,061 million, Taco Bell $17,247 million and Wendy’s $11,898 million in 2025 U.S. system-wide sales
System-wide sales add franchised and company restaurants together. McDonald’s reported over $38 billion for Q3 2026, up 4%, Restaurant Brands $12,972 million, and Domino’s global retail sales of $4,840.4 million. The QSR 50 lists McDonald’s 2025 U.S. system-wide sales at $55,061 million.
Go if
Skip if
Why #2 over #3: It measures the whole brand, while comparable sales only measures older restaurants.
3
Fast Food Traffic vs Check Growth
Photo: Harrison Keely / CC BY 4.0 via Wikimedia Commons
Answrs Verdict
Definition: McDonald’s: comparable sales are driven by changes in guest counts and average check, the latter affected by pricing and product mixChipotle, Q3 2026: Comparable restaurant sales increased 2.1%, including a 1.3% increase in average check and a 0.8% increase in transactionsMcDonald’s U.S., Q3 2026: Comparable sales declined slightly as negative comparable guest counts were largely offset by positive check growthWendy’s, Q2 2026: U.S. Company-operated restaurant margin fell mainly on commodity inflation, a decline in traffic and labor rate inflation, partly offset by an increase in average checkPercentages: Not published: the McDonald’s and Wendy’s releases read give no separate guest count or check percentage
Chipotle split its 2.1% Q3 2026 comparable sales into a 1.3% increase in average check and a 0.8% increase in transactions. McDonald’s said U.S. guest counts were negative but largely offset by check growth, and Wendy’s cited a decline in traffic in Q2 2026. Neither McDonald’s nor Wendy’s gives a percentage in the release read.
Go if
Skip if
Why #3 over #4: It shows whether growth comes from more customers or higher prices, which a comparable sales total hides.
4
Fast Food Digital Sales Mix
Photo: Tdorante10 / CC BY-SA 4.0 via Wikimedia Commons
Answrs Verdict
Definition: Yum! Brands: digital system sales include all transactions at system restaurants where consumers use an ordering interaction primarily facilitated by automated technologyYum! Brands, Q3 2026: Digital system sales over $9 billion, with digital mix reaching 64%, excluding Pizza HutChipotle, Q3 2026: Digital sales were 38.8% of total food and beverage revenue versus 36.7% in the third quarter of 2025Domino’s, 2025: More than 85% of U.S. retail sales came through digital channels in 2025McDonald’s: Not published: the Q3 2026 release read gives no digital sales share
Yum! Brands reported digital system sales over $9 billion and a digital mix of 64% in Q3 2026, excluding Pizza Hut. Chipotle reported 38.8% of food and beverage revenue, up from 36.7%, and Domino’s said more than 85% of U.S. retail sales in 2025 came through digital channels. McDonald’s gives no share in its Q3 2026 release.
Go if
Skip if
Why #4 over #5: It shows how much revenue arrives through apps and kiosks, which a sales total does not.
5
Fast Food Average Unit Volume
Photo: Tony Webster from Minneapolis, Minnesota, United States / CC BY 2.0 via Wikimedia Commons
Answrs Verdict
Definition: Chipotle: average restaurant sales are the average trailing 12-month food and beverage revenue for company-owned restaurants open at least 12 full calendar monthsChipotle, Q3 2026: Average restaurant sales of $3,106 thousand, against $3,132 thousand a year earlier (release table in thousands of dollars)QSR 50, 2025 average sales per unit: McDonald’s $4,088 thousand, Taco Bell $2,216 thousand, Wendy’s $2,001 thousand, Burger King $1,660 thousand and Domino’s $1,385 thousandQSR 50, estimated: Chick-fil-A $7,700 thousand and Shake Shack $4,048 thousand, both marked as estimated by QSR; Raising Cane’s $6,580 thousand as submittedQuarterly releases: Not published: the Yum! Brands, Restaurant Brands, Wendy’s and Domino’s releases read give no average unit volume
Chipotle reported average restaurant sales of $3,106 thousand in Q3 2026 against $3,132 thousand a year earlier. The QSR 50 lists McDonald’s at $4,088 thousand, Taco Bell $2,216 thousand and Wendy’s $2,001 thousand for 2025, with QSR estimating Chick-fil-A at $7,700 thousand.
Go if
Skip if
Why #5 over #6: It shows what one restaurant earns, while system-wide sales mix every restaurant together.
6
Fast Food Franchise Royalty Revenue
Photo: Andykatib / CC0 via Wikimedia Commons
Answrs Verdict
Definition: Domino’s: franchisees pay royalties and, in the U.S., advertising fees that are based on a percentage of franchise retail salesDomino’s, Q3 2026: U.S. franchise royalties and fees of $165,638 thousand versus $157,155 thousand, and international franchise royalties and fees of $83,700 thousand versus $78,549 thousandMcDonald’s, Q3 2026: Revenues from franchised restaurants of $4,487 million versus $4,363 million, up 3%Yum! Brands, Q3 2026: Franchise and property revenues of $854 million versus $857 millionWendy’s, Q2 2026: Operating profit fell partly on lower franchise royalty revenue; no dollar figure appears in the release read
Domino’s reported U.S. franchise royalties and fees of $165,638 thousand and international of $83,700 thousand in Q3 2026. McDonald’s revenues from franchised restaurants were $4,487 million and Yum! Brands franchise and property revenues $854 million. Wendy’s cited lower franchise royalty revenue without a dollar figure.
Go if
Skip if
Why #6 over #7: It is the revenue franchisors book, which restaurant sales only drive indirectly.
7
Fast Food Restaurant-Level Margin
Photo: FGCphoenix (talk) / CC BY-SA 3.0 via Wikimedia Commons
Answrs Verdict
Definition: Chipotle: restaurant level operating margin is total revenue less direct restaurant operating costs, expressed as a percent of total revenueChipotle, Q3 2026: Restaurant level operating margin of 23.3%, a decrease from 24.5%Shake Shack, Q2 2026: Restaurant-level profit of $92.7 million, or 23.0% of Shack sales, with same-Shack sales up 3.5%Yum! Brands, Q3 2026: Company restaurant margin of 13.4% versus 15.8% consolidated, with 20.2% at the Taco Bell Division and 12.3% at the KFC DivisionWendy’s, Q2 2026: U.S. Company-operated restaurant margin of 13.8% versus 16.2% a year earlier
Chipotle reported a restaurant level operating margin of 23.3% in Q3 2026 versus 24.5%. Shake Shack reported 23.0% of Shack sales in Q2 2026, Yum! Brands 13.4% consolidated company restaurant margin, and Wendy’s 13.8% for its U.S. Company-operated restaurants in Q2 2026.
Go if
Skip if
Why #7 over #8: It shows how much sales are kept at the restaurant, which unit growth does not.
8
Fast Food Net Unit Growth
Photo: Hullian111 / CC BY-SA 4.0 via Wikimedia Commons
Answrs Verdict
Definition: Domino’s: net store growth nets gross store openings with gross store closures during the periodDomino’s, Q3 2026: Global net store growth of 175 stores, including 26 net store openings in the U.S. and 149 internationallyChipotle, Q3 2026: Opened 84 company-owned restaurants, 53 with a Chipotlane; 4,267 company-owned restaurants versus 3,916 a year earlierYum! Brands, Q3 2026: Unit count increased 7% including 955 gross new units in the quarter, excluding Pizza HutQSR 50, 2025 change in U.S. units: Chipotle up 294, McDonald’s up 147 and Taco Bell up 180 units from 2024
Domino’s reported global net store growth of 175 stores in Q3 2026, with 26 in the U.S. and 149 internationally. Chipotle opened 84 company-owned restaurants and reached 4,267, and Yum! Brands reported a 7% unit count increase with 955 gross new units. The QSR 50 shows Chipotle adding 294 U.S. units in 2025.
Go if
Skip if
Why #8 over #9: It shows growth from new locations, which loyalty and digital mix cannot.
9
Fast Food Loyalty Member Sales
Photo: Harrison Keely / CC BY 4.0 via Wikimedia Commons
Answrs Verdict
Definition: McDonald’s: systemwide sales to loyalty members are all sales to customers who self-identify as a loyalty member, measured across 70 markets with loyalty programsMcDonald’s, Q3 2026: Systemwide sales to loyalty members were $41 billion for the trailing twelve months and more than $11 billion for the quarterChipotle, Q3 2026: Digital sales include revenue deferrals associated with Chipotle Rewards; the release gives no separate loyalty sales figureOther chains: Not published: the Yum! Brands, Restaurant Brands, Domino’s and Wendy’s releases read give no loyalty-member sales figure
McDonald’s reported systemwide sales to loyalty members of $41 billion over the trailing twelve months and more than $11 billion in Q3 2026 across 70 markets. Chipotle includes Chipotle Rewards deferrals in digital sales without a separate loyalty figure, and no other chain read publishes one.
Go if
Skip if
Why #9 over #10: It shows repeat customers, which a drive-thru study cannot.
10
Fast Food Drive-Thru Service Time
Photo: Tim Malone, www.timmalone.id.au, aka User:Tdmalone / CC BY-SA 2.5 via Wikimedia Commons
Answrs Verdict
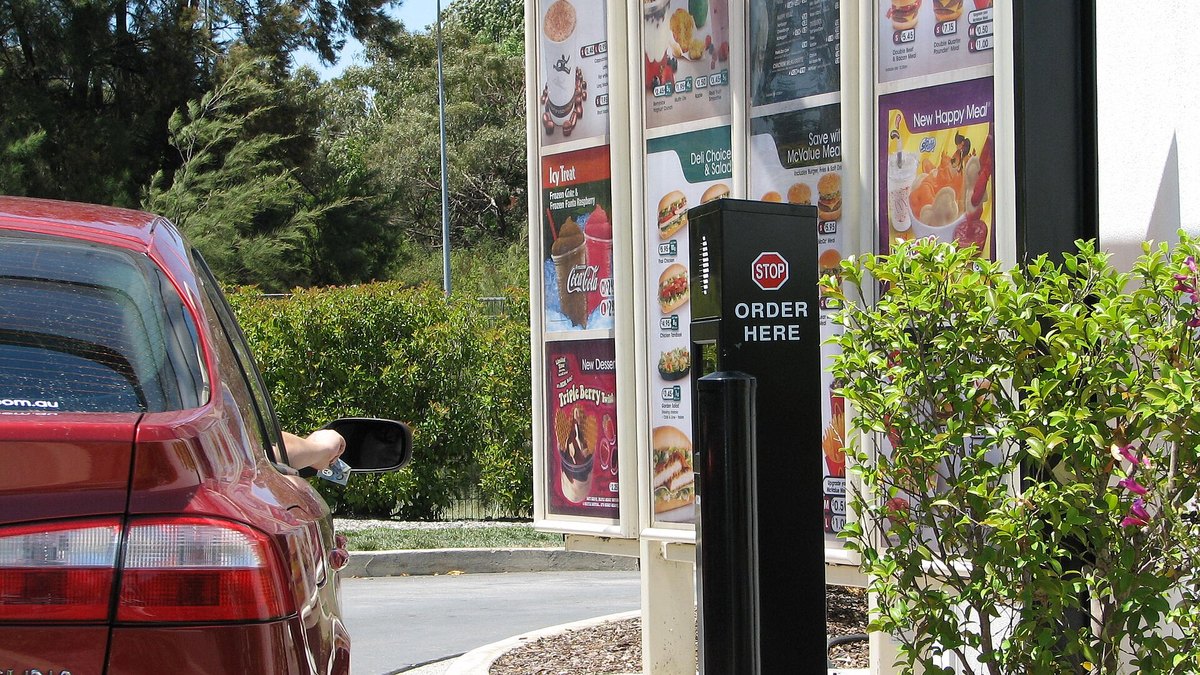
Definition: Intouch Insight: service time is the amount of time from the shopper placing the order until exiting the drive-thru with the foodIntouch Insight and QSR, 2025: Taco Bell 4:16 total time, KFC 4:21 and Tim Hortons 4:25; the Classic segment averaged 5 minutes and 9 secondsVoice AI orders, 2025: AI-enabled orders ran 3 minutes and 53 seconds against a 4 minutes and 15 seconds average, with accuracy of 83% versus 87%Study timing: Published October 1, 2025 from shops done between June and July 2025, so it is older than the 2026 releases on this pageMcDonald’s and Wendy’s: Not published: the press release lists no total time for either chain
The Intouch Insight 25th Annual Drive-Thru Study with QSR Magazine put Taco Bell at 4:16 total time, KFC at 4:21 and Tim Hortons at 4:25, with the Classic segment at 5 minutes and 9 seconds. AI-enabled orders ran 3 minutes and 53 seconds against a 4 minutes and 15 seconds average. The study was published in October 2025.
Go if
Skip if
How we ranked these
We ranked ten fast food chain revenue KPIs by how directly each measures a chain’s revenue and whether a public filing, the QSR 50 or the Intouch Insight drive-thru study publishes a figure for it. Benchmarks come from the McDonald’s third quarter 2026 release (November 2026), the Yum! Brands third quarter 2026 release (November 2026), the Restaurant Brands International third quarter 2026 release (October 2026), the Chipotle third quarter 2026 release (October 2026), the Domino’s third quarter 2026 release (October 2026), the Wendy’s second quarter 2026 release (August 2026), the Shake Shack second quarter 2026 release (August 2026), the QSR 50 2026 (August 2026, covering 2025) and the Intouch Insight 25th Annual Drive-Thru Study press release (October 2025). The Wendy’s and Shake Shack figures are older because their third quarter results were not out when this page was written, and the drive-thru study is the oldest source. Figures come from the company releases filed with the SEC, the QSR 50 table and the Intouch Insight release; we did not read the full quarterly reports, Shake Shack’s shareholder letter or the full drive-thru study, and we found no Technomic or National Restaurant Association figure to cite. Periods differ by company and QSR marks some QSR 50 figures as its own estimates, so compare each with its own history first. Where no figure is published, we say so instead of estimating. This is business information, not investment advice. Facts are taken from each maker's own published information; check the official site before you buy.
Questions people ask
What is comparable sales growth at a fast food chain?
McDonald’s defines comparable sales as sales at restaurants open at least thirteen months, driven by guest counts and average check. It reported global comparable sales up 1.5% in Q3 2026, with the U.S. down 0.2%.
How much of Chipotle’s sales are digital?
Chipotle reported digital sales of 38.8% of total food and beverage revenue in Q3 2026, up from 36.7% a year earlier. Yum! Brands reported a digital mix of 64%, excluding Pizza Hut.
What is average unit volume for fast food chains?
Chipotle reported average restaurant sales of $3,106 thousand in Q3 2026. The QSR 50 lists 2025 average sales per unit of $4,088 thousand for McDonald’s and $2,001 thousand for Wendy’s.
How fast is the fastest drive-thru?
The Intouch Insight and QSR Magazine 2025 study put Taco Bell fastest at 4:16 total time, ahead of KFC at 4:21 and Tim Hortons at 4:25. The study was published in October 2025.
Comparable sales growth in the latest reported quarter, in percent, as reported (Shake Shack is second quarter 2026) at a glance
Domino’s U.S.0.3 %
McDonald’s1.5 %
Chipotle2.1 %
Shake Shack3.5 %
Restaurant Brands3.8 %
Comparable sales growth in the latest reported quarter, in percent, as reported (Shake Shack is second quarter 2026), as published by each maker. Picks without a published figure are left off.