Cycle time is the best KPI for an auto body shop in 2027, followed by severity ($4,768 average total cost of repair through Q3 2025, per CCC) and touch time. CCC data shows repairs with no calibrations averaging 13 days keys-to-keys, against more than 17 with multiple calibrations. Where no source publishes a benchmark, this page says so.
Share of repair estimates that include at least one calibration
Estimators and owners pricing and scheduling repairs on newer vehicles
Pick by what you want
Best overall
Cycle Time
Best for revenue
Severity (Average Repair Cost)
Best for the shop floor
Touch Time
Best for the paint department
Paint and Materials Cost per Paint Hour
Best for modern vehicles
ADAS Calibration Rate
The ranking
1
Cycle Time
Photo: Scientificranking / CC BY 4.0 via Wikimedia Commons
Answrs VerdictThe headline KPI.
Formula: Average calendar days from the date the vehicle is received to the date it is delivered, for repairs closed in the monthBenchmark: 13 days keys-to-keys with no calibrations, 15.5 with one calibration, more than 17 with multiple calibrations (CCC)Insurer view: J.D. Power puts the average for repairable vehicles at 19.3 days, down from 22.3 days a year earlierOlder target: BodyShop Business (2011): under five days for driveable vehicles, under 10 for non-driveable
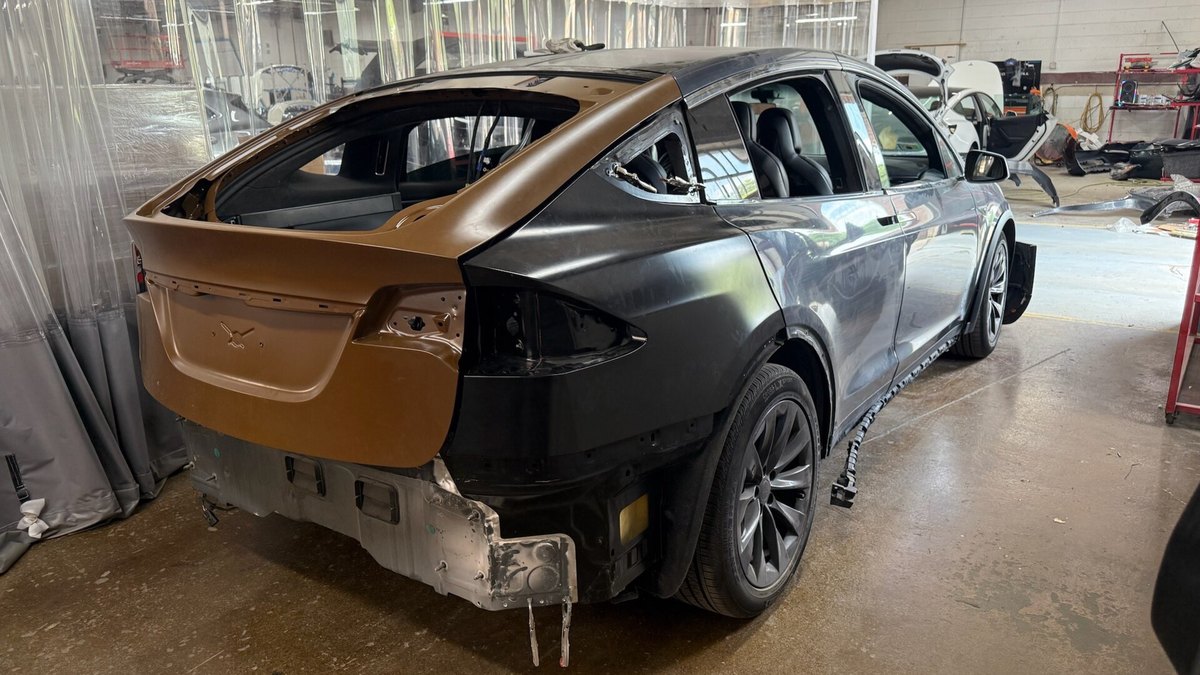
Cycle time is the average calendar days from the date a vehicle is received to the date it is delivered. CCC data reported by AutoBody News shows 13 days keys-to-keys with no calibrations, 15.5 with one and more than 17 with multiple calibrations, while J.D. Power puts the insurer-side average at 19.3 days.
Go ifEvery shop; it is the one number insurers, customers and your production floor all feel
Skip ifNever skip it, but do not quote one number without writing down how you measure it
Why #1 over #2: Every other KPI on this list ends up inside the cycle-time number, which is why severity ranks behind it.
2
Severity (Average Repair Cost)
Photo: JoachimKohler-HB / CC BY-SA 4.0 via Wikimedia Commons
Answrs VerdictThe revenue-per-repair KPI.
Formula: Average repair dollars per repair order (RO)Benchmark: CCC puts the average total cost of repair at $4,768 through Q3 2025, up 1.4% year over yearRelated measure: Sales per RO = total sales divided by ROsCost trend: CCC expects the full-year 2025 increase to be below 2%
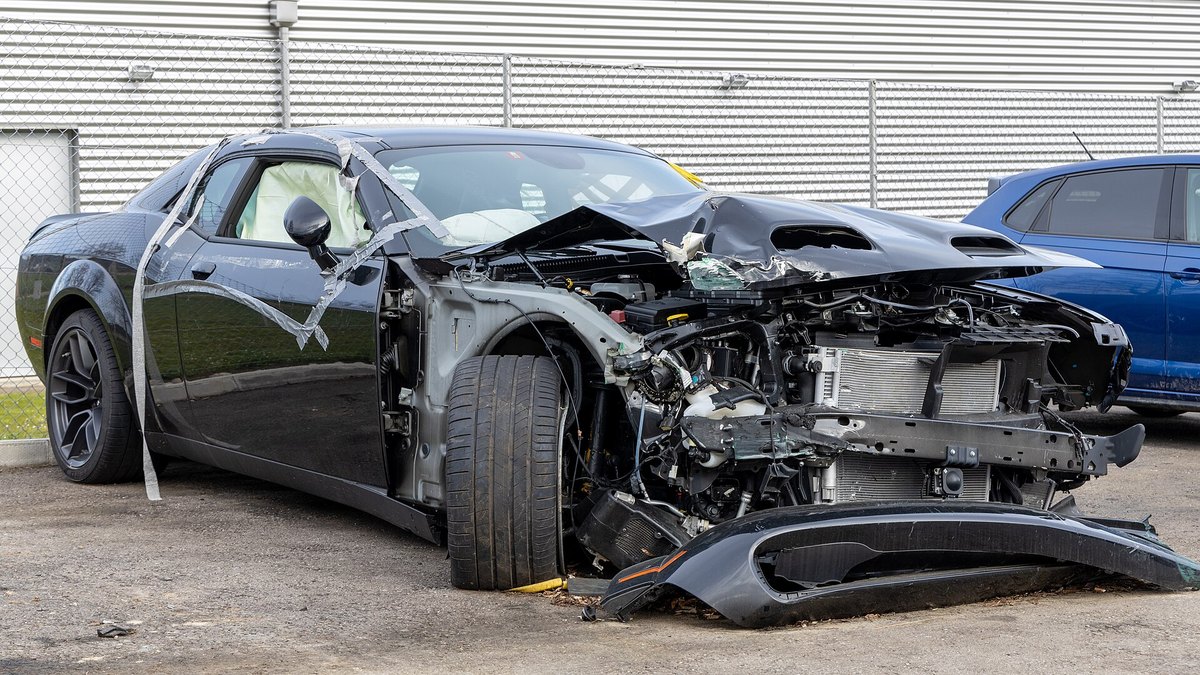
Severity is the average repair dollars per repair order. CCC puts the average total cost of repair at $4,768 through Q3 2025, up 1.4% year over year, which makes it the clearest read on whether repair complexity is reaching your invoices.
Go ifEstimators and owners who want to see whether complexity is reaching the invoice
Skip ifYou track only volume and never revenue per repair
Why #2 over #3: It turns throughput into dollars, which touch time alone cannot do.
3
Touch Time
Photo: GreatOaksPR / CC BY 4.0 via Wikimedia Commons
Answrs VerdictShows where cycle time hides.
Formula: Average billed hours produced per day per RO, for example a 20-hour job finished in four days is 5 hours per dayBenchmark: Insurers generally use four hours per day, though some have moved to five (BodyShop Business, 2011)Definition: The average duration of time each vehicle is worked on per day
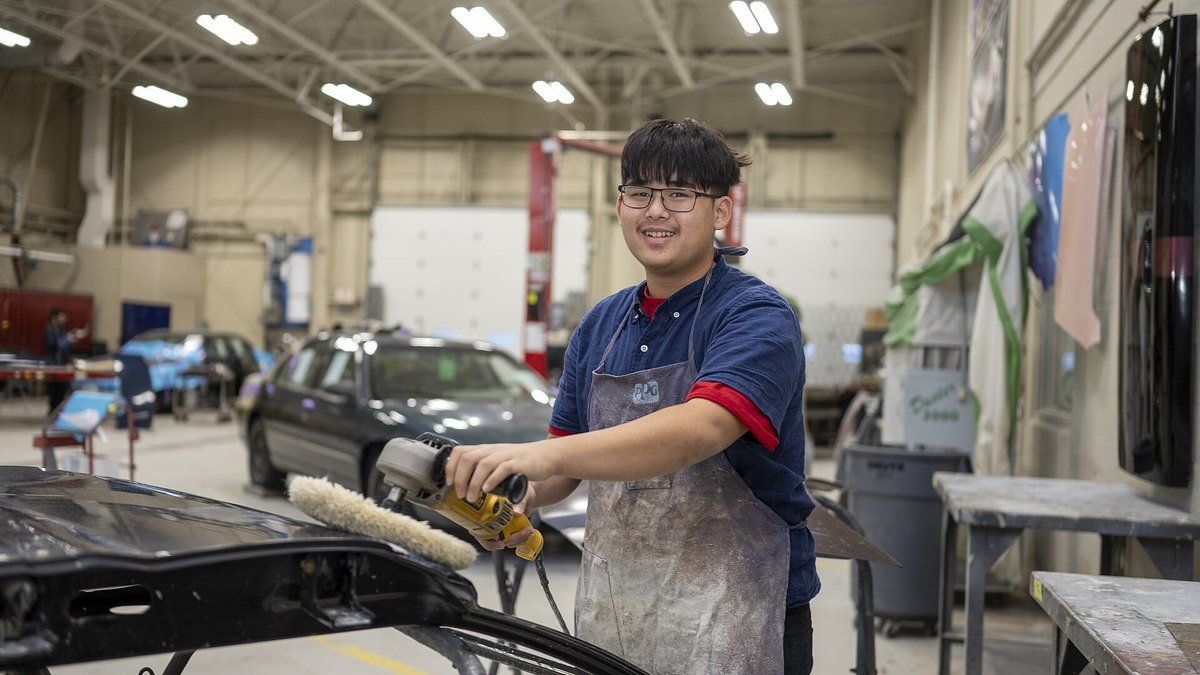
Touch time is the average billed hours produced per day per repair order. BodyShop Business reported in 2011 that insurers generally use four hours per day, though some have moved to five.
Go ifProduction managers hunting for idle days inside the cycle
Skip ifYou only have a few repairs open at a time
Why #3 over #4: It explains idle days inside the cycle, which technician efficiency cannot show.
4
Technician Efficiency
Photo: U.S. Air Force photo by Airman 1st Class Jessi Roth / Public domain via Wikimedia Commons
Answrs VerdictThe labor-return KPI.
Formula: Efficiency % = sold hours / worked hours x 100Worked example: 10 sold hours over 8 worked hours is 125%Shop-level version: Overall productivity = total labor hours divided by total tech clock hoursBenchmark: No benchmark published in the sources cited
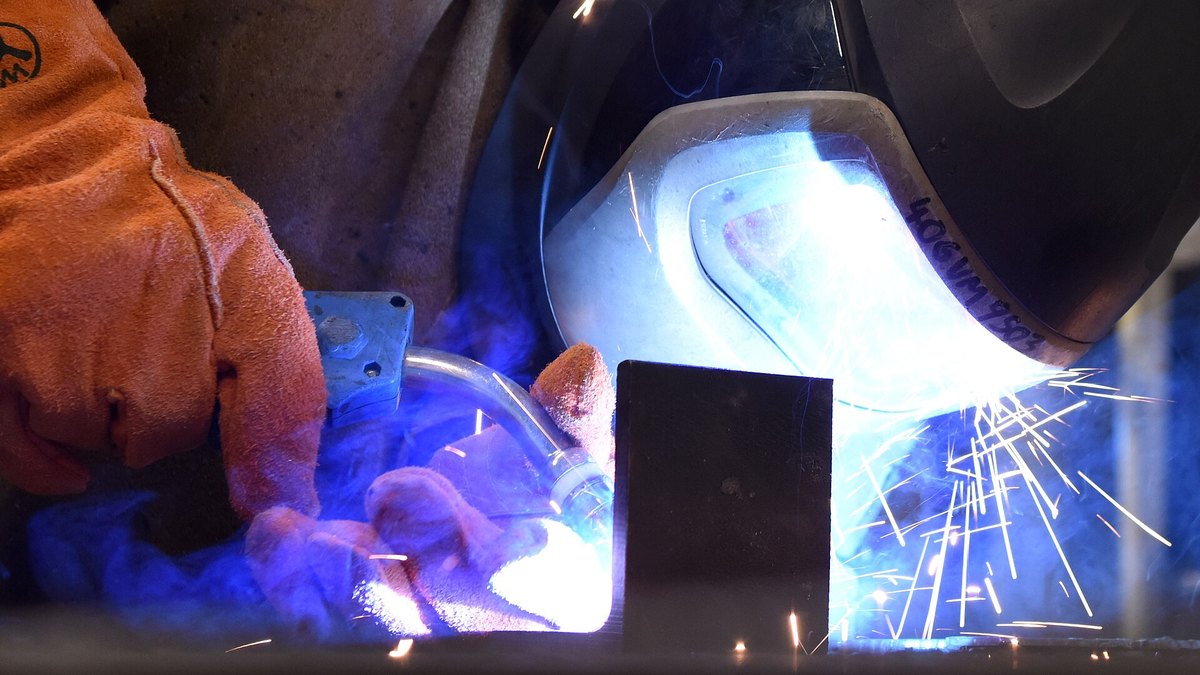
Technician efficiency is sold hours divided by worked hours times 100, so 10 sold hours over 8 worked hours is 125%. The sources cited publish the formula but no industry benchmark.
Go ifOwners who pay technicians flat rate and need to see the true return on each clock hour
Skip ifYou have no shop management system to capture clock hours
Why #4 over #5: It measures return on each paid clock hour, where gross profit margin only reports the month-end result.
5
Gross Profit Margin
Photo: University of the Fraser Valley / CC BY 2.0 via Wikimedia Commons
Answrs VerdictThe bottom-line KPI.
Formula: Total gross profit divided by total salesIncludes: Labor, parts, paint and materials and sublet gross profit combinedNet profit: FenderBender calls net profit the ultimate KPI for any business, tracked in dollars or as a percent of total salesBenchmark: No benchmark published in the sources cited
Gross profit margin is total gross profit divided by total sales, covering labor, parts, paint and materials and sublet. FenderBender calls net profit the ultimate KPI for any business.
Go ifOwners who want one scoreboard that rolls every department together
Skip ifYou want a daily floor metric; this one is a month-end read
Why #5 over #6: It rolls every department into one number, where paint cost per hour covers only refinish.
6
Paint and Materials Cost per Paint Hour
Photo: KelvinJM / CC BY-SA 4.0 via Wikimedia Commons
Answrs VerdictThe refinish-cost KPI.
Formula: Paint and materials cost divided by paint hoursBest usage measure: Paint-only cost per paint hour, which the source calls the most reliable measure of paint usageSanity check: Paint-only cost as a share of P&M cost: below 63% or above 73% can signal misclassified costsMethod: Track paint at refinish (list) pricing rather than net of discounts so results compare to industry benchmarks
Paint and materials cost per paint hour is paint and materials cost divided by paint hours. BASF’s definitions call paint-only cost per paint hour the most reliable measure of paint usage.
Go ifPaint managers who need to see margin leaking out of the refinish department
Skip ifYou outsource all refinish work
Why #6 over #7: It is more actionable day to day than booth hours because it points at spending, not just capacity.
7
Paint Booth Hours per Day
Photo: Windywocket / CC BY-SA 4.0 via Wikimedia Commons
Answrs VerdictThe capacity-use KPI.
Formula: Paint hours produced per booth per day, to show capacity utilizationBenchmark: A booth can typically produce about 300 paint hours per week (FenderBender example)Example shop: An example shop averaged 175 hours per week on one boothRelated measure: Vehicles per day per booth = ROs divided by workdays divided by paint booths
Paint booth hours per day shows capacity utilization. FenderBender notes a booth can typically produce about 300 paint hours per week, and its example shop averaged 175 hours per week on one booth.
Go ifShops with one booth that is the bottleneck for every repair
Skip ifYour booth sits idle because body work is the constraint
Why #7 over #8: It exposes the booth bottleneck, which parts margin does not touch.
8
Parts Gross Profit
Photo: JoachimKohler-HB / CC BY-SA 4.0 via Wikimedia Commons
Answrs VerdictThe parts-margin KPI.
Formula: Parts gross profit divided by parts salesCompanion ratio: Parts to labor sales = parts sales divided by total labor salesMarket signal: CCC data showed average part prices up more than 4% year over year in March and April 2025Benchmark: No benchmark published in the sources cited
Parts gross profit is parts gross profit divided by parts sales. CCC data showed average part prices up more than 4% year over year in March and April 2025, so the margin needs watching.
Go ifParts managers watching margin as prices and sourcing rules shift
Skip ifYou rarely order parts
Why #8 over #9: It measures the largest purchased input, where CSI measures only the customer outcome.
9
Customer Satisfaction (CSI)
Photo: selbst fotografiert / HAUK MEDIEN ARCHIV / Alexander Hauk / www.bayernnachrichte / Attribution via Wikimedia Commons
Answrs VerdictThe customer-verdict KPI.
Formula: The overall Customer Satisfaction Index score generated by the center’s CSI system or vendorIndustry context: J.D. Power’s 2025 claims study scored overall satisfaction at 700 on a 1,000-point scaleRepair link: Satisfaction for repairable vehicles rose 9 points as cycle times shortenedBenchmark: No shop-level CSI benchmark published in the sources cited
CSI is the overall customer satisfaction score from your CSI system or vendor. J.D. Power’s 2025 claims study scored overall satisfaction at 700 on a 1,000-point scale and found repairable-vehicle satisfaction up 9 points as cycle times shortened.
Go ifShops that depend on insurer programs and repeat customers
Skip ifYou do not survey customers after delivery
Why #9 over #10: It is the customer’s verdict, which complements the calibration rate’s view of repair complexity.
10
ADAS Calibration Rate
Photo: Shixart1985 / CC BY 2.0 via Wikimedia Commons
Answrs VerdictThe modern-repair KPI.
Formula: Share of repair estimates that include at least one calibrationBenchmark: 35.6% of DRP estimates in Q3 2025, up from 26.9% in Q3 2024 (CCC)Wider data: Calibrations appeared on 23% of repairable appraisals in 2025 versus 0.9% in 2017Cycle impact: Repairs with no calibrations averaged 13 days keys-to-keys versus more than 17 with multiple
ADAS calibration rate is the share of estimates that include at least one calibration. CCC found 35.6% of DRP estimates included one in Q3 2025, up from 26.9% a year earlier.
Go ifEstimators and owners pricing and scheduling repairs on newer vehicles
Skip ifYou work mostly on older vehicles without driver-assist systems
How we ranked these
We ranked KPIs on how directly they drive collision-shop results and how clearly industry sources define them, using CCC data reported by AutoBody News and Repairer Driven News, FenderBender, BodyShop Business, BASF and J.D. Power. We cite a benchmark only where a source states one, and several figures come from different definitions of cycle time, so compare them with care. Facts are taken from each maker's own published information; check the official site before you buy.
Questions people ask
What is the most important KPI for an auto body shop?
Cycle time is the headline KPI: the average calendar days from vehicle receipt to delivery. CCC data shows repairs with no calibrations averaging 13 days keys-to-keys.
How many KPIs should a collision shop track?
FenderBender advises focusing on three to five KPIs at a time and tracking each over a period of at least 90 days.
How is technician efficiency calculated?
Efficiency % equals sold hours divided by worked hours times 100, so 10 sold hours over 8 worked hours is 125%.
Is there a published benchmark for touch time?
BodyShop Business reported in 2011 that insurers generally use four hours per day, with some at five; treat it as a dated reference point.
Keys-to-keys cycle time at a glance
No calibrations13 days
One calibration15.5 days
Multiple calibrations17 days
J.D. Power average, repairable vehicles19.3 days
Keys-to-keys cycle time, as published by each maker. Picks without a published figure are left off.