Active students enrolled is the top KPI for tutoring centers in 2027, followed by assessment-to-enrollment conversion and length of stay. Club Z franchisees working 35 or more hours per week averaged 52 private students in 2025; Huntington centers turned inquiries into academic evaluations at 58% and evaluations into enrollments at 64% in 2024, and Learning Center students stayed 95 hours on average. No franchisor cited publishes a churn rate or cost per lead, and this page says so where a figure is missing.
The number of students with an active paid enrollment on a given date; Nerdy defines Active Members as Learners with an active paid Learning Membership as of the dates presented
Owners and directors: every revenue line on a tutoring P&L starts with how many students are enrolled this month
Two steps of the sales funnel: the AE Rate, the ratio of academic evaluations to inquiries, and the Enroll Rate, the ratio of enrollments to evaluations, as Huntington defines them
Center directors: it shows whether leads are lost before the free assessment or after it, at the enrollment conference
Revenue per enrolled student per month, set by hourly price and hours booked; Nerdy reports ARPM, its average Consumer Learning Membership subscription revenue per member per month
Pricing decisions: more sessions per week and test prep both lift revenue per student without adding a single lead
Score or grade-level growth over a set number of instruction hours
Marketing and parent conferences: documented gains are what turn an evaluation into an enrollment and a renewal
Pick by what you want
Best overall
Tutoring Center Active Students Enrolled
Best for the sales funnel
Tutoring Center Assessment-to-Enrollment Conversion
Best for retention
Tutoring Center Length of Stay and Session Frequency
Best for pricing
Tutoring Center Average Revenue per Student
Best for labor cost
Tutoring Center Tutor Pay Ratio
The ranking
1
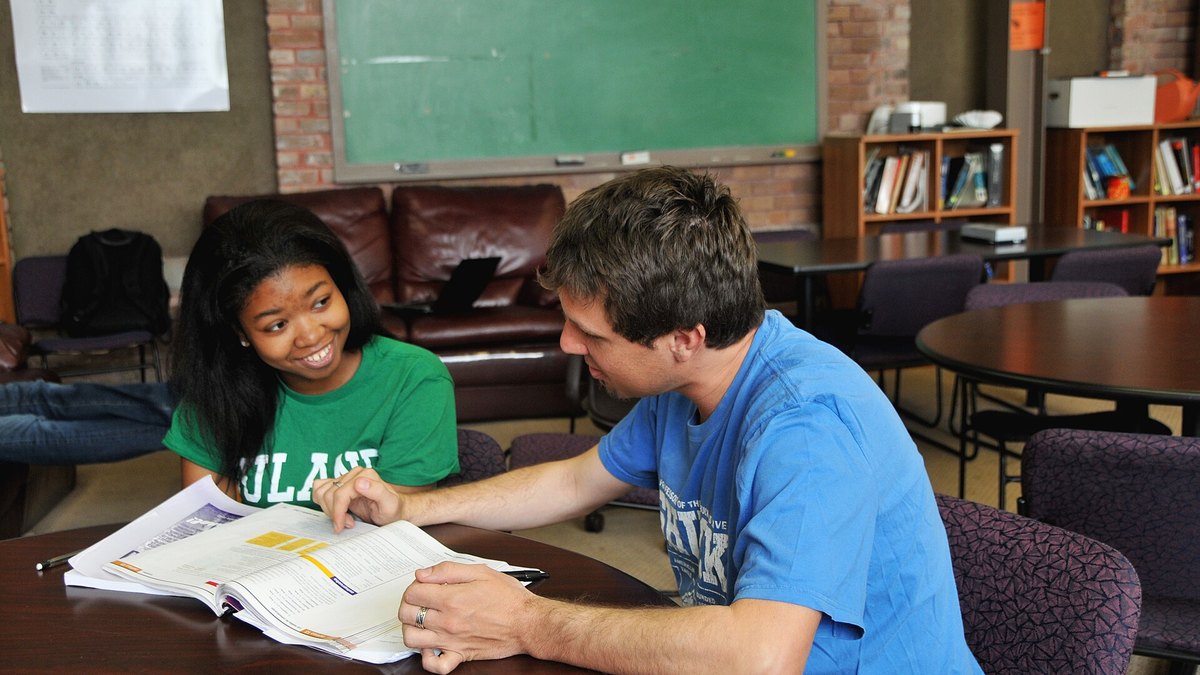
Tutoring Center Active Students Enrolled
Photo: Tulane Public Relations / CC BY 2.0 via Wikimedia Commons
Answrs VerdictThe headline tutoring center KPI.
What it measures: The number of students with an active paid enrollment on a given date; Nerdy defines Active Members as Learners with an active paid Learning Membership as of the dates presentedClub Z, full-time owners: Franchisees working 35 or more hours per week averaged 52 private students in 2025 (median 47); 166 or 52% of its 319 franchised businesses were in this groupClub Z, part-time owners: Franchisees working 20-30 hours per week averaged 40 private students (median 30); those working 10-20 hours averaged 20Nerdy (Varsity Tutors): 33.2 thousand Active Members at December 31, 2025 against 37.5 thousand at December 31, 2024, a decline it puts primarily down to operational challenges
Active students enrolled counts the students paying this month. Club Z franchisees working 35 or more hours per week averaged 52 private students in 2025 and those working 20-30 hours averaged 40, while Nerdy had 33.2 thousand Active Members at December 31, 2025.
Go ifOwners and directors: every revenue line on a tutoring P&L starts with how many students are enrolled this month
Skip ifYou want a student count for Mathnasium, Huntington or Sylvan centers; their Item 19s cited here report revenue, not students
Why #1 over #2: Every other KPI on this list is a rate applied to the student count, so it ranks first.
2
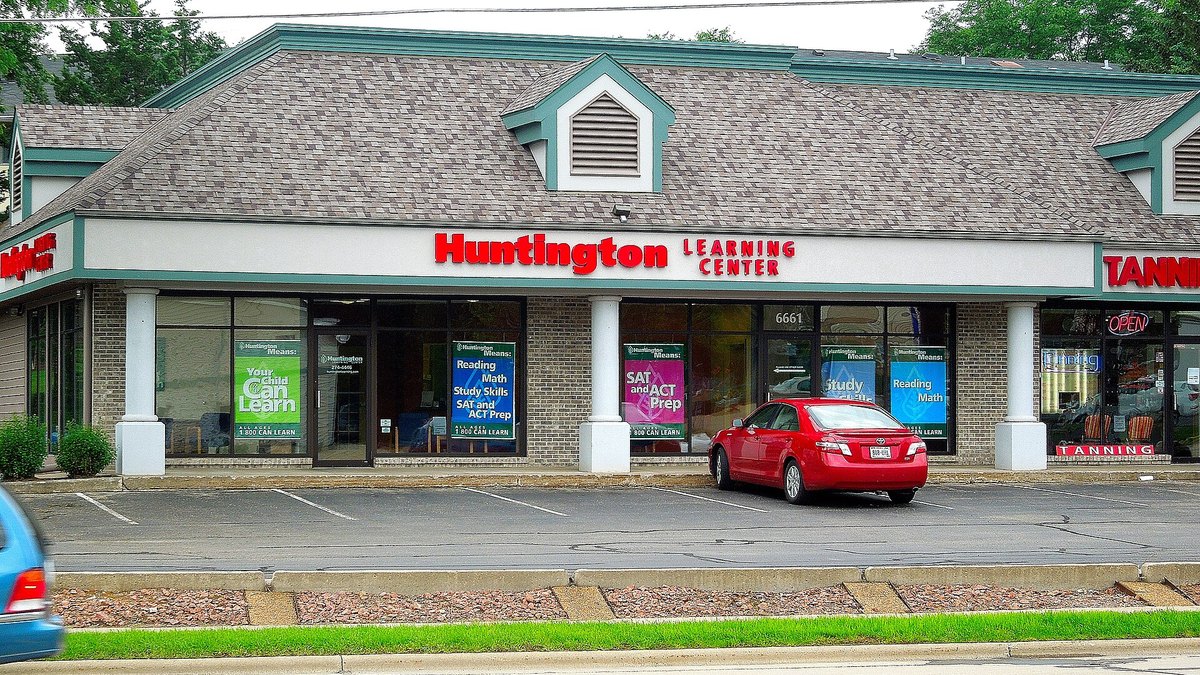
Tutoring Center Assessment-to-Enrollment Conversion
Photo: Corey Coyle / CC BY 3.0 via Wikimedia Commons
Answrs VerdictThe sales funnel KPI.
What it measures: Two steps of the sales funnel: the AE Rate, the ratio of academic evaluations to inquiries, and the Enroll Rate, the ratio of enrollments to evaluations, as Huntington defines themHuntington AE Rate, 2024: Learning Center AE Rate averaged 58% (median 57%) and Test Prep 64% (median 66%) at franchised centers open all of 2024Huntington Enroll Rate, 2024: System Learning Center Enroll Rate averaged 64%; the Exam Prep Enroll Rate averaged 61%Nerdy: Lists better site conversion on its new homepage among its AI-driven wins in 2025, without publishing a rate
Conversion tracks how many inquiries book an academic evaluation and how many evaluations enroll. Huntington franchised centers averaged a 58% Learning Center AE Rate and a 64% Learning Center Enroll Rate in 2024, with a 61% Exam Prep Enroll Rate.
Go ifCenter directors: it shows whether leads are lost before the free assessment or after it, at the enrollment conference
Skip ifYou need a second brand to compare with; Huntington is the only franchisor cited here that publishes both rates
Why #2 over #3: New enrollments refill the student count, while length of stay only decides how long they last.
3
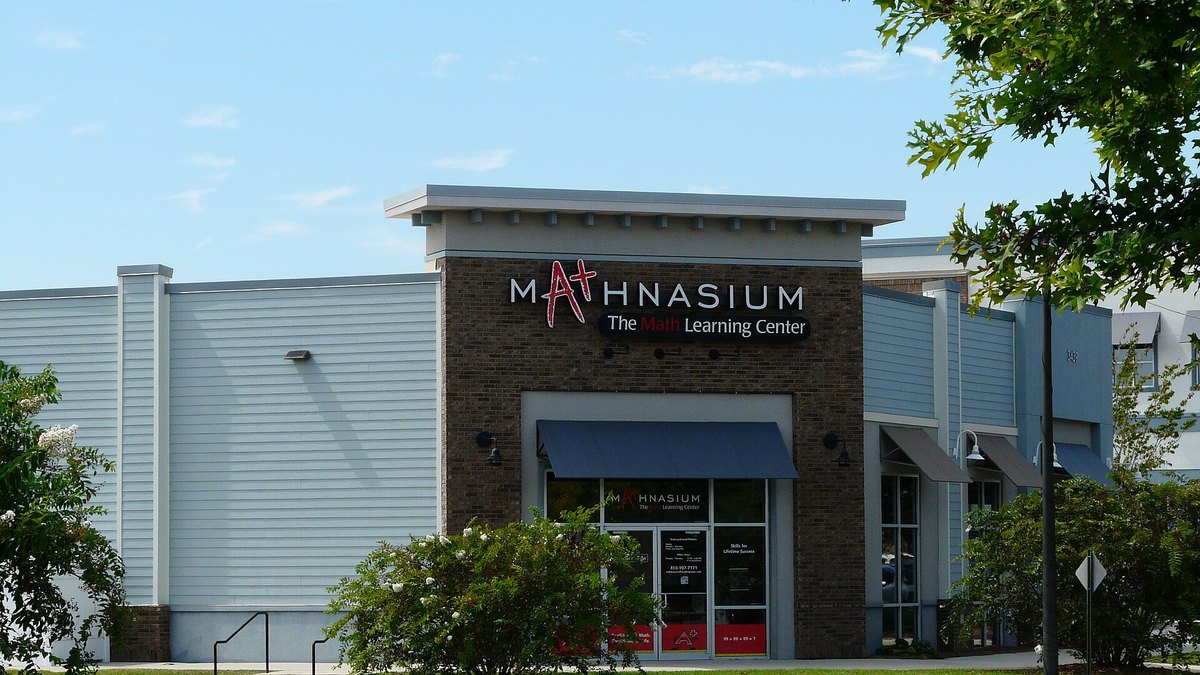
Tutoring Center Length of Stay and Session Frequency
Photo: The Bushranger / CC BY-SA 4.0 via Wikimedia Commons
Answrs VerdictThe retention KPI.
What it measures: How many hours a student uses before ceasing instruction, and how often they attend; Huntington calls the first figure Length of StayHuntington Length of Stay, 2024: Learning Center Length of Stay averaged 95 hours (median 92) and Test Prep 40 hours (median 39)Mathnasium: Recommends students attend 2-3 times per week, as attending less frequently will slow results and attending too often could lead to burnoutMathnasium session length: A Mathnasium center recommends 2-3 60-minute sessions per weekNerdy: Says new Expert incentives brought faster time to the first session, more sessions in the first 30 days, lower tutor replacement rates and higher retention
Length of stay is the number of hours a student uses before stopping. Huntington Learning Center students averaged 95 hours and Test Prep students 40 hours in 2024, and Mathnasium recommends 2-3 sessions per week.
Go ifRetention planning: length of stay is the published stand-in for churn, since it shows how long a student keeps paying
Skip ifYou want a monthly churn or six-month retention rate; none of the franchisors or filings cited here publish one
Why #3 over #4: Hours per student multiply revenue per student, so keeping students ranks above raising price.
4
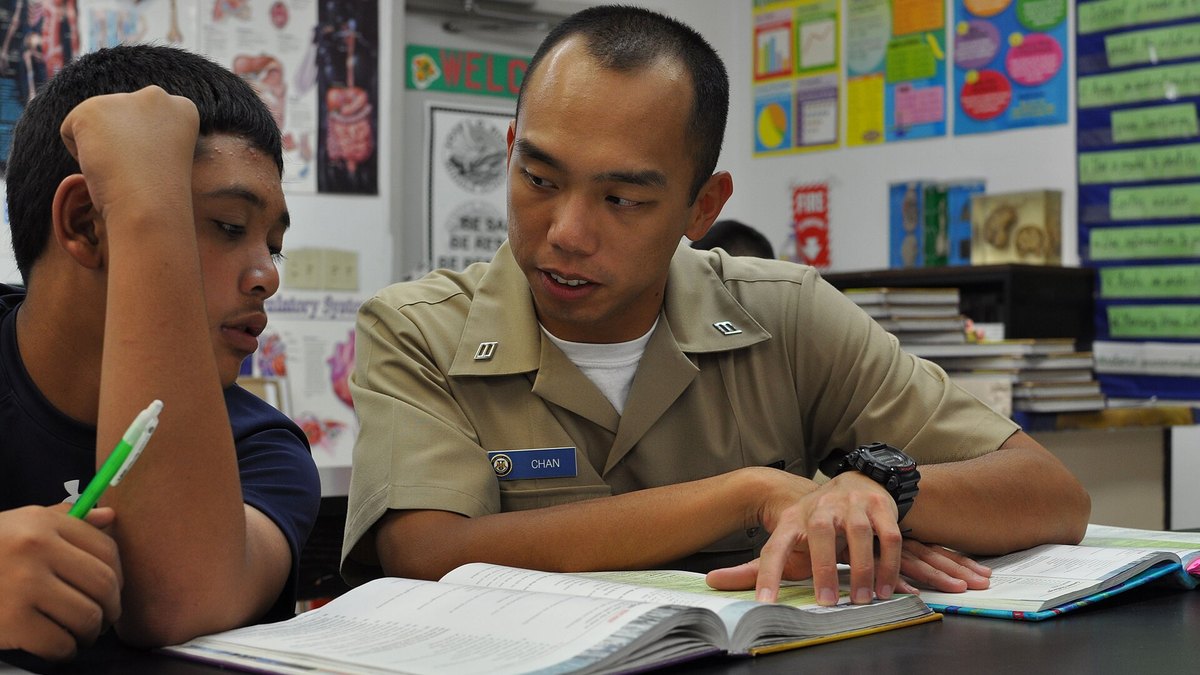
Tutoring Center Average Revenue per Student
Photo: Official Navy Page from United States of America
Alexavier Allen/U.S. Navy / Public domain via Wikimedia Commons
Answrs VerdictThe pricing KPI.
What it measures: Revenue per enrolled student per month, set by hourly price and hours booked; Nerdy reports ARPM, its average Consumer Learning Membership subscription revenue per member per monthNerdy ARPM: $364 at December 31, 2025 against $302 at December 31, 2024, up 21%, from a shift to higher frequency Learning Memberships and price increases for new Consumer customersHuntington hourly tuition, 2024: Learning Center tuition averaged $61 per hour and Exam Prep $82 per hour at franchised centersClub Z client rates: Average client pay rates of $52 per hour for elementary, $55 for middle school, $57 for high school and $125 for test preparationHuntington sales mix, 2024: Learning Center service averaged 60% of center sales, Test Prep 22%, Subject Tutoring 7% and Other 11%
Revenue per student combines hourly price and hours booked. Nerdy's ARPM was $364 at December 31, 2025, up 21%; Huntington tuition averaged $61 per hour for Learning Center and $82 for Exam Prep, and Club Z test preparation averaged $125 per hour.
Go ifPricing decisions: more sessions per week and test prep both lift revenue per student without adding a single lead
Skip ifYou compare monthly and hourly figures directly; Nerdy reports per member per month, Huntington and Club Z per hour
Why #4 over #5: Price per student is a lever an owner controls, while revenue per center is the result.
5
Tutoring Center Gross Revenue per Center
Photo: Social Woodlands from USA / CC BY 2.0 via Wikimedia Commons
Answrs VerdictThe scale KPI.
What it measures: Annual gross receipts per center, including student tuition, registration and testing fees and sales of learning materialsMathnasium, 2025: Average gross receipts of $384,874 and median $326,428 for centers open 12 months or more; the top quarter of 229 centers averaged $693,314Huntington, 2025: 232 franchised centers open the entire year averaged $609,454 (median $533,106); the top quartile of 58 centers averaged $1,115,433Sylvan, 2025: 409 centers operated all 12 months of 2025 and reported revenue; the top quartile of 102 units averaged $795,074 (median $588,669) and the second quartile $355,018
Revenue per center is the system benchmark. Mathnasium centers averaged $384,874 in 2025 (median $326,428), Huntington mature centers $609,454, and Sylvan's top quartile $795,074.
Go ifFranchise buyers and multi-unit owners benchmarking a center against the system
Skip ifYou read the average alone; at Mathnasium, Huntington and Sylvan the median sits below the average because top centers pull it up
Why #5 over #6: Revenue sets the scale; tutor pay decides how much of it is kept.
6
Tutoring Center Tutor Pay Ratio
Photo: morrillmemoriallibrary / CC BY-SA 4.0 via Wikimedia Commons
Answrs VerdictThe labor cost KPI.
What it measures: Instructor pay as a share of revenue, or tutor pay per hour against the hourly price chargedMathnasium, 2025: Instructor payroll of $79,182, 20.6% of average gross receipts, across 914 covered centersHuntington, 2024: Teacher pay averaged 26% of gross revenue at company-owned centersClub Z tutor pay: Average tutor pay of $21 per hour for elementary, $23 for middle school, $25 for high school and $28 for test preparationNerdy, 2025: Cost of revenue of 42% of revenue against 33% in 2024, with higher Expert costs from investments in Expert pay and incentives
The tutor pay ratio is instructor pay as a share of revenue. Mathnasium instructor payroll was 20.6% of gross receipts in 2025, Huntington teacher pay averaged 26% at company-owned centers, and Club Z tutors averaged $21 to $28 per hour against client rates of $52 to $125.
Go ifOwners setting schedules: tutor hours paid but not billed show up here first
Skip ifYou want a utilization rate; none of the sources cited publish billed hours as a share of paid tutor hours
Why #6 over #7: Tutor pay is the largest cost a director controls week to week, so it ranks above the overall margin.
7
Tutoring Center Operating Profit Margin
Photo: Chris Light / CC BY-SA 4.0 via Wikimedia Commons
Answrs VerdictThe profitability KPI.
What it measures: What is left of revenue after tutor pay, rent, royalties and marketingMathnasium, 2025 average P&L: Operating profit of $117,000, 30.4% of gross receipts, after royalties and marketing fees of 17.4% and rent of 12.8%Huntington, 2024 estimate: Gross Margin of $224,240 and a Gross Margin Percent of 38%, after Principal Expenses of $365,335Nerdy, 2025: Gross profit of 58% of revenue and an operating loss of $61,864 thousand on revenue of $178,988 thousand
Operating margin shows what is left after tutor pay, rent, royalties and marketing. Mathnasium's 2025 average P&L showed operating profit of $117,000, 30.4% of gross receipts, and Huntington estimated a 38% Gross Margin Percent for 2024.
Go ifComparing a center with the system average once tutor pay, rent and fees are paid
Skip ifYou compare definitions loosely; Huntington estimates gross margin from principal expenses only, not a full P&L
Why #7 over #8: Margin sums up the cost KPIs, including marketing spend below.
8
Tutoring Center Marketing Spend and Acquisition Cost
Photo: Tony Webster / CC BY 2.0 via Wikimedia Commons
Answrs VerdictThe acquisition cost KPI.
What it measures: What it costs to generate inquiries and enrollments, tracked as marketing spend per center and per new studentHuntington, 2024: Minimum advertising of $57,000 a year in its gross margin estimate; Call Center fees averaged $1,088 per month at 186 centers that used itMathnasium fees: Monthly marketing fee of $250 plus 2% of gross receipts, plus a digital and local marketing fee of a minimum of $1,000 per monthNerdy, 2025: Sales and marketing expenses of $60,123 thousand, 34% of revenue, against $71,623 thousand in 2024
Marketing spend is the cost of filling the funnel. Huntington's estimate assumes minimum advertising of $57,000 a year, Mathnasium charges a marketing fee of $250 plus 2% plus at least $1,000 a month for local marketing, and Nerdy spent 34% of revenue on sales and marketing in 2025.
Go ifOwners checking whether lead spend is paying back through the evaluation and enrollment rates above
Skip ifYou want a published cost per lead or CAC; none of the franchisors or filings cited here disclose one
Why #8 over #9: Acquisition cost hits the P&L every month, while the tutor ratio is a program design choice.
9
Tutoring Center Student-to-Tutor Ratio
Photo: Tulane Public Relations / CC BY 2.0 via Wikimedia Commons
Answrs VerdictThe delivery model KPI.
What it measures: How many students each instructor teaches at once, which sets both tutor cost per student and how personal the session isSylvan: SylvanSync reading and math intervention for grades 1-12 has a 3:1 maximum student to teacher ratio; Ace it! small-group tutoring an 8:1 maximumHuntington school programs: A Worthington and Columbus, Ohio program ran at a 4:1 ratio; Centerville and Clinton Massie, Ohio math ran in small groups of 3:1Nerdy: About 16 thousand Active Experts in 2025, defined as Experts who instructed one or more sessions in the period
The student-to-tutor ratio sets cost per student and how personal sessions are. Sylvan publishes a 3:1 maximum for SylvanSync and 8:1 for Ace it!, and Huntington school programs ran at 4:1 and 3:1.
Go ifProgram design: a higher ratio lowers tutor cost per student, a lower one is what parents pay a premium for
Skip ifYou want a system-wide average ratio; the brands cited publish program maximums, not averages
Why #9 over #10: The ratio drives tutor cost directly, while learning gains are slower to measure.
10
Tutoring Center Learning Gains (Score Improvement)
Photo: Preply.com Images / CC BY 2.0 via Wikimedia Commons
Answrs VerdictThe outcome KPI.
What it measures: Score or grade-level growth over a set number of instruction hoursHuntington, Fort Collins: One-on-one tutoring for 60 hours, with reading scores rising 18 percentile points and math 11 percentile points (release of October 15, 2024)Huntington, Skokie: A 48-hour online program raised students 2.1 grade levels in reading and 1.3 grade levels in mathHuntington, Englewood: A 48-hour, small-group SAT program produced an average score increase of 134 pointsMathnasium: Says multiple independent studies found it improves student performance on standards-based tests in 20 sessions or fewer
Learning gains measure score growth per hour of instruction. Huntington reported 2.1 grade levels in reading from a 48-hour online program and an average SAT increase of 134 points from a 48-hour small-group program; Mathnasium cites gains in 20 sessions or fewer.
Go ifMarketing and parent conferences: documented gains are what turn an evaluation into an enrollment and a renewal
Skip ifYou need audited, system-wide outcomes; the results cited are company-reported for specific school programs
How we ranked these
We ranked KPIs on how directly each one drives enrollment, revenue and profit at a tutoring center and on how many of five operators publish it, using the Item 19 financial performance representations in Huntington Learning Centers' 2025 and 2026 FDDs, Sylvan Learning's 2026 FDD and Club Z!'s 2026 FDD, Franchise Chatter's review of Mathnasium's 2026 FDD Item 19, Nerdy's 2025 Form 10-K, and Mathnasium, Sylvan and Huntington program pages. Brands define KPIs differently, so each figure names its brand and period. No source cited publishes a churn rate, cost per lead, CAC, tutor utilization rate or net promoter score, and the page says so rather than estimate one. Facts are taken from each maker's own published information; check the official site before you buy.
Questions people ask
What is the most important KPI for a tutoring center?
Active students enrolled, because revenue, tutor hours and profit all follow from it. Club Z franchisees working 35 or more hours per week averaged 52 private students in 2025, and Nerdy had 33.2 thousand Active Members at December 31, 2025.
What is a good assessment-to-enrollment conversion rate for a tutoring center?
At Huntington franchised centers in 2024, the Learning Center AE Rate (evaluations over inquiries) averaged 58% and the Learning Center Enroll Rate (enrollments over evaluations) averaged 64%.
How much revenue does a tutoring center make?
Mathnasium centers open 12 months or more averaged $384,874 in gross receipts in 2025 (median $326,428). Huntington franchised centers open all of 2025 averaged $609,454, and Sylvan's top quartile averaged $795,074.
How much of revenue goes to tutor pay?
Mathnasium's 2025 average P&L shows instructor payroll at 20.6% of gross receipts, and Huntington reports teacher pay of 26% of gross revenue at company-owned centers in 2024.
Average hourly tuition by service, latest reported at a glance
Club Z elementary$52
Club Z middle school$55
Club Z high school$57
Huntington Learning Center (2024)$61
Huntington Exam Prep (2024)$82
Club Z test preparation$125
Average hourly tuition by service, latest reported, as published by each maker. Picks without a published figure are left off.