Top 10 Manufacturing KPIs for Overall Equipment Effectiveness in 2027
By Kory White · Updated Nov 2026 · 4 min read
Direct answer
Overall equipment effectiveness (OEE) is the top manufacturing KPI for equipment in 2027, followed by availability rate and performance rate. OEE is availability times performance times quality; the often-quoted 85% world-class figure is a convention tied to Seiichi Nakajima, not measured data, and Vorne says most plants are closer to 60%. The Federal Reserve put U.S. manufacturing capacity utilization at 75.9% in September 2026. Where no public benchmark exists, this page says so and explains how to measure it.
Availability times Performance times Quality, the share of scheduled running time during which production actually met quality criteria; 100% is a theoretical reference point (Wikipedia, OEE article)
Plants that want one number that shows how much scheduled time turns into good parts
The percentage of scheduled time (loading time) that equipment is available to operate; a pure measure of uptime that excludes quality and performance effects (Wikipedia, OEE article)
Plants with breakdowns, changeovers or starved lines that need to see where time goes
The speed at which equipment runs as a percentage of its theoretical maximal speed; it captures deliberately reduced speed, minor stops and speed fluctuations (Wikipedia, OEE article)
Lines that run all shift yet fall short of rated output
Good units produced as a percentage of total units produced; commonly called first pass yield (FPY), First Time Right (FTR) or First Time Quality (FTQ) (Wikipedia, OEE article)
Plants where scrap and rework are hidden behind high output
Output as a percent of capacity, seasonally adjusted, published by the Federal Reserve for total manufacturing and for each NAICS industry group (Federal Reserve G.17)
Planners and lenders judging how much slack the sector has
The predicted elapsed time between inherent failures of a repairable system during normal operation, calculated as the arithmetic mean time between failures (Wikipedia)
Maintenance teams ranking machines by how often they stop
The total corrective maintenance time for failures divided by the number of corrective maintenance actions in a period; it generally excludes lead time for parts not readily available (Wikipedia)
Plants that want shorter downtime events, with spares and skills as the levers
OEE losses are subdivided into the “Six Big Losses” so that specific countermeasures can be applied to each (Wikipedia, OEE article)
Plants ready to turn an OEE number into a list of fixes
Pick by what you want
Best overall
Overall Equipment Effectiveness (OEE)
Best for downtime
Availability Rate (Equipment Uptime)
Best for slow running
Performance Rate (Equipment Speed)
Best for scrap
Quality Rate (First Pass Yield)
Best for adding shifts
Total Effective Equipment Performance (TEEP)
Best for maintenance
Mean Time Between Failures (MTBF)
The ranking
1
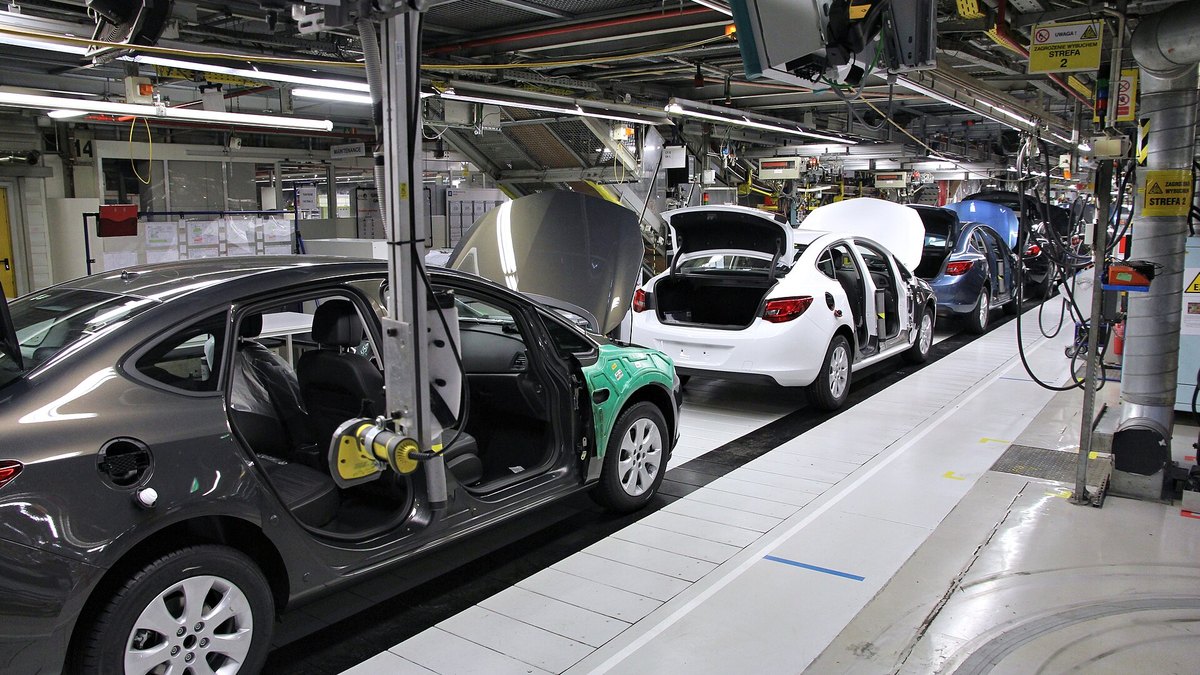
Overall Equipment Effectiveness (OEE)
Photo: Marek Ślusarczyk (Tupungato) / CC BY 3.0 via Wikimedia Commons
Answrs VerdictThe headline KPI.
Definition: Availability times Performance times Quality, the share of scheduled running time during which production actually met quality criteria; 100% is a theoretical reference point (Wikipedia, OEE article)Origin: The term OEE was first mentioned in Seiichi Nakajima’s book “TPM Tenkai” in 1982 and was described as a central part of Total Productive MaintenanceThe 85% convention: Vorne’s oee.com says it is often thought that a world-class OEE score is 85%, and that Nakajima noted Distinguished Plant Prize winners had OEE scores in excess of 85%; the page is undated and gives the figure as a convention, not a surveyTypical plants: The same page says most manufacturing companies have OEE scores closer to 60%, and that it sees more companies below 45% than above 85% (a vendor’s own observation)Benchmark: No public OEE survey was found; Wikipedia says an OEE number is not suitable for comparing machines or benchmarking, so ISO 22400-2:2014 (formulas, units and time behaviour for a selected set of KPIs; paid text, not read in full) is the place to align definitions
OEE is the product of availability, performance and quality. Wikipedia’s example multiplies 86.6%, 93% and 91.3% to get 73.6%. The 85% world-class figure is a convention, not measured data.
Go ifPlants that want one number that shows how much scheduled time turns into good parts
Skip ifYou want to rank people or plants against each other; the number is for finding losses on one machine
Why #1 over #2: It is the whole equation, which no single component is.
2
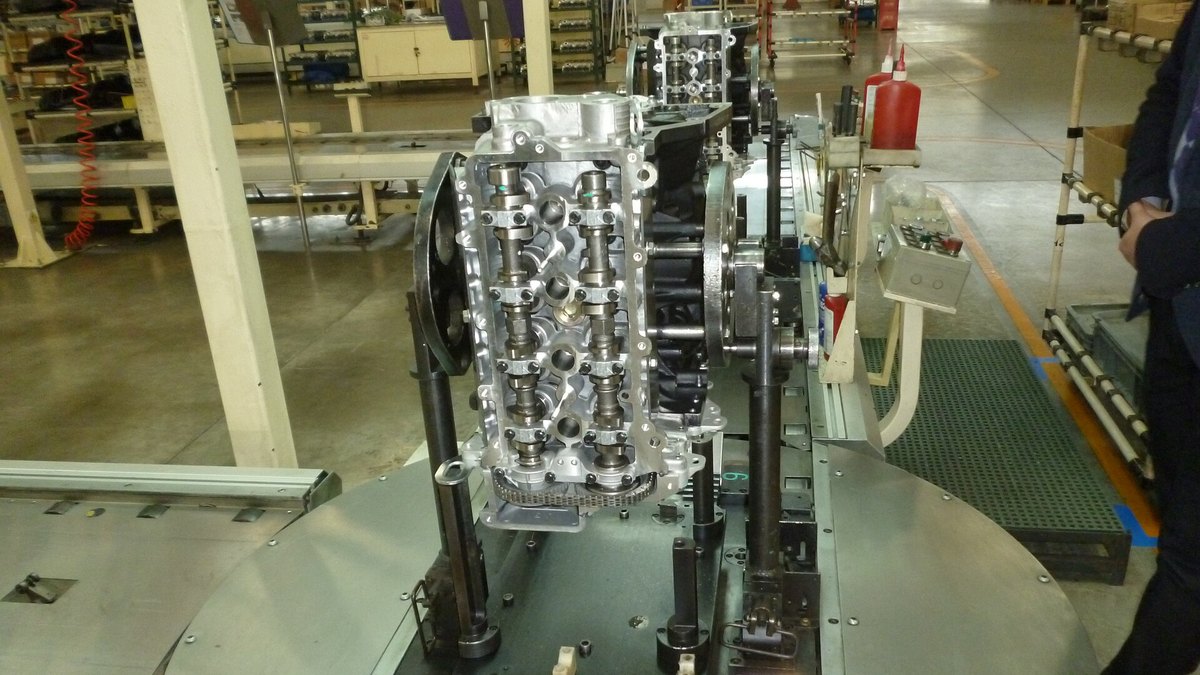
Availability Rate (Equipment Uptime)
Photo: Tangray-nick / CC BY-SA 4.0 via Wikimedia Commons
Answrs VerdictThe downtime KPI.
Definition: The percentage of scheduled time (loading time) that equipment is available to operate; a pure measure of uptime that excludes quality and performance effects (Wikipedia, OEE article)Worked example: A machine scheduled for an 8-hour (480-minute) shift with a 30-minute break and a 60-minute breakdown actually operated 390 minutesNIST MEP case study: Keats Manufacturing (page created November 2, 2023): a system on its hydraulic presses collected the number of cycles, current available for production and number of defective parts to measure availability, performance and qualityBenchmark: No public availability benchmark by industry was found; divide logged run time by scheduled time and log every stop reason
Availability is scheduled time the equipment can run. In Wikipedia’s example, a 480-minute shift with a 30-minute break and a 60-minute breakdown leaves 390 minutes of operation.
Go ifPlants with breakdowns, changeovers or starved lines that need to see where time goes
Skip ifYour equipment never stops but runs slowly or makes scrap; look at performance and quality
Why #2 over #3: It locates lost time, which speed and quality cannot.
3
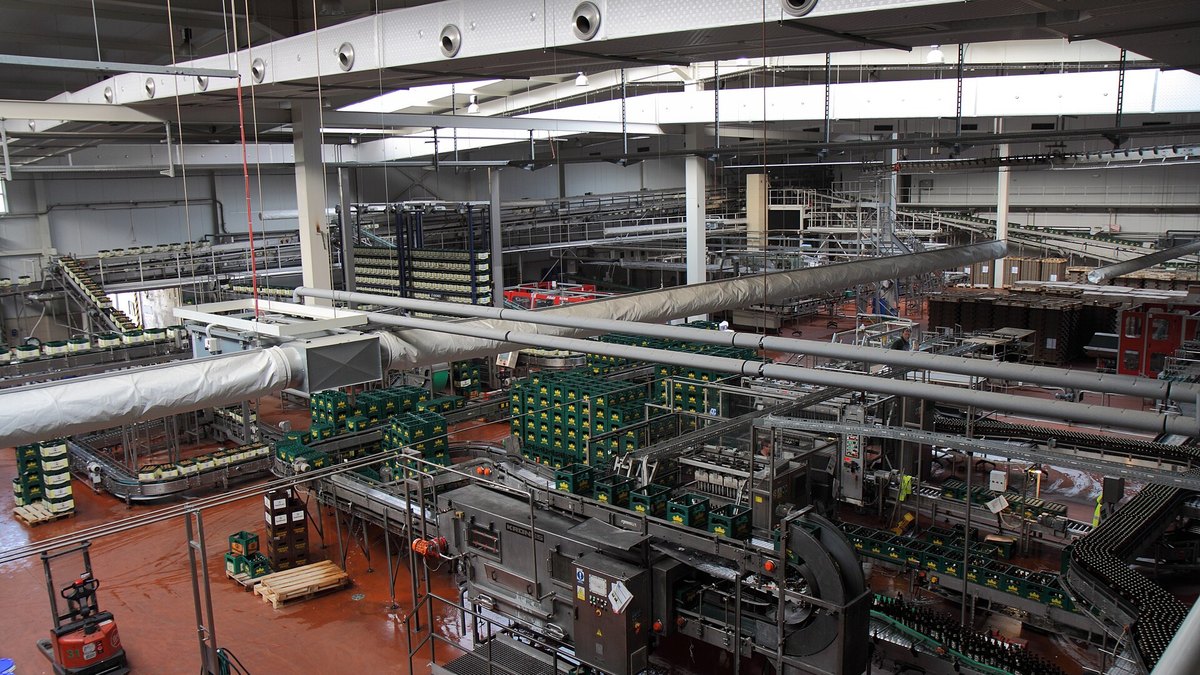
Performance Rate (Equipment Speed)
Photo: Petr Kadlec / CC BY-SA 3.0 via Wikimedia Commons
Answrs VerdictThe speed-loss KPI.
Definition: The speed at which equipment runs as a percentage of its theoretical maximal speed; it captures deliberately reduced speed, minor stops and speed fluctuations (Wikipedia, OEE article)Minor stops: Downtime smaller than a set threshold is not counted in availability, so it shows up as a performance lossGuidance: Vorne’s oee.com advises teams to focus on improving their OEE rather than fixating on its absolute valueBenchmark: No public performance-rate benchmark was found; set the ideal rate from the equipment’s theoretical maximal speed and write down how it was chosen
Performance is actual speed against theoretical maximal speed, and it holds minor stops and slow running. Vorne advises focusing on improving OEE rather than its absolute value.
Go ifLines that run all shift yet fall short of rated output
Skip ifYou have no agreed ideal cycle time; a made-up ideal rate makes the number meaningless
Why #3 over #4: It finds hidden slow running, which uptime misses.
4
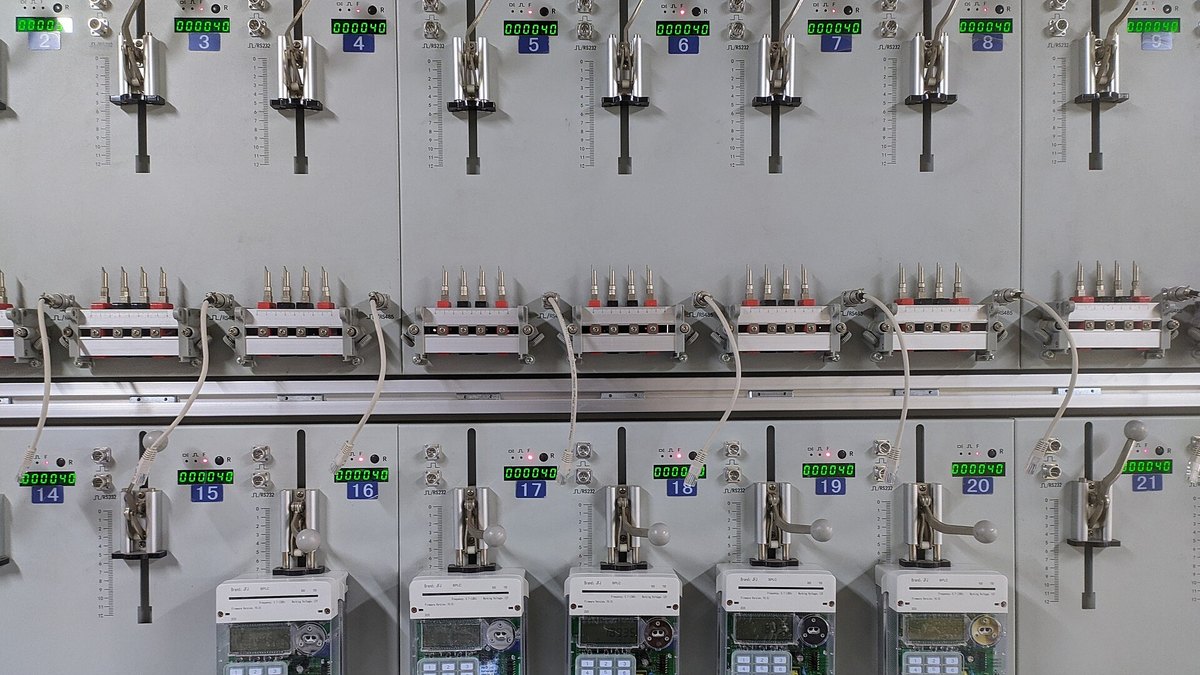
Quality Rate (First Pass Yield)
Photo: Rht bd / CC BY-SA 4.0 via Wikimedia Commons
Answrs VerdictThe good-parts KPI.
Definition: Good units produced as a percentage of total units produced; commonly called first pass yield (FPY), First Time Right (FTR) or First Time Quality (FTQ) (Wikipedia, OEE article)Why the parts matter: Two shifts can both show 56% OEE: one at 75% availability, 85% performance and 95% quality, the other at 85%, 95% and 75%; they need different fixesWhere defects are found: Wikipedia describes a “discovery principle”: apply the OEE reduction to the equipment where the error was discovered, since quality problems are often found downstreamBenchmark: No public quality-rate benchmark across industries was found; count first-time-good units against total units for each run
Quality is good units over total units, also called first pass yield. Two shifts at 56% OEE can have 95% quality or 75% quality, which is why the parts matter.
Go ifPlants where scrap and rework are hidden behind high output
Skip ifDefects are found weeks later by customers; add a field-return KPI
Why #4 over #5: It prices scrap, which availability ignores.
5
Total Effective Equipment Performance (TEEP)
Photo: Vijayarme2011 / CC BY-SA 4.0 via Wikimedia Commons
Answrs VerdictThe capacity-hunting KPI.
Definition: OEE multiplied by the loading rate, so it measures effectiveness against calendar hours rather than only scheduled hours (Wikipedia, OEE article)Reference point: A TEEP of 100% means the operation ran at 100% OEE 24 hours a day and 365 days a yearLoading rate: The percentage of time the equipment is scheduled to operate compared with the total calendar time availableBenchmark: No public TEEP benchmark was found; it is useful when deciding whether to add a shift before buying another machine
TEEP multiplies OEE by the loading rate. A TEEP of 100% means 100% OEE for 24 hours a day and 365 days a year.
Go ifOwners deciding whether to run more shifts or buy more capacity
Skip ifThe plant is legally or practically limited to one shift; use OEE
Why #5 over #6: It looks at unused calendar time, which OEE excludes by design.
6
Capacity Utilization (Manufacturing)
Photo: Nick Allen / CC BY-SA 4.0 via Wikimedia Commons
Answrs VerdictThe sector-context KPI.
Definition: Output as a percent of capacity, seasonally adjusted, published by the Federal Reserve for total manufacturing and for each NAICS industry group (Federal Reserve G.17)September 2026, manufacturing: The preliminary rate was 75.9%, against a 1972-2025 average of 78.2%, a 1994-95 high of 84.6% and a 2009 low of 63.4% (Federal Reserve G.17, released October 16, 2026)September 2026, by industry: Electrical equipment, appliances and components 86.9%; machinery 84.3%; fabricated metal products 78.8%; food, beverage and tobacco 77.3%; computer and electronic products 75.9%; aerospace and miscellaneous transportation equipment 73.8%; chemicals 72.3%; primary metals 68.0%; motor vehicles and parts 67.8%Revision notice: The Federal Reserve plans an annual revision on November 24, 2026 with a 2022 base year, so figures here may changeBenchmark: This is an industry-level rate from Federal Reserve estimates, not a plant OEE; do not compare a plant’s OEE with it
The Federal Reserve put manufacturing capacity utilization at 75.9% in September 2026, with machinery at 84.3% and motor vehicles and parts at 67.8%.
Go ifPlanners and lenders judging how much slack the sector has
Skip ifYou need a number for one line; it is a sector measure
Why #6 over #7: It gives sector context, which an in-plant number cannot.
7
Mean Time Between Failures (MTBF)
Photo: Marcin Wichary / CC BY 2.0 via Wikimedia Commons
Answrs VerdictThe reliability KPI.
Definition: The predicted elapsed time between inherent failures of a repairable system during normal operation, calculated as the arithmetic mean time between failures (Wikipedia)Worked example: Three identical systems fail after 100, 120 and 130 hours, so MTBF is 116.667 hours; for non-repairable systems the term is mean time to failure (MTTF)What counts as a failure: Units taken down for routine scheduled maintenance are not counted as failures, and the result depends on how failure is definedBenchmark: No public MTBF benchmark applies across plants because it depends on the failure definition; track it by machine from your own stop log
MTBF is the mean time between failures of a repairable system. Wikipedia’s example of failures at 100, 120 and 130 hours gives 116.667 hours.
Go ifMaintenance teams ranking machines by how often they stop
Skip ifYou have only a handful of failures to average; the number swings too much
Why #7 over #8: It counts how often machines stop, which TEEP does not.
8
Mean Time to Repair (MTTR)
Photo: Official U.S. Navy Imagery / Public domain via Wikimedia Commons
Answrs VerdictThe recovery-speed KPI.
Definition: The total corrective maintenance time for failures divided by the number of corrective maintenance actions in a period; it generally excludes lead time for parts not readily available (Wikipedia)Repair versus recovery: Wikipedia distinguishes mean time to repair from mean time to recovery, which starts when the failure is first discoveredContract example: A service contract guaranteeing a 24-hour mean time to repair, with parts and travel delays adding up to a mean of 6 days, is no better than one guaranteeing recovery in 7 daysBenchmark: No public MTTR benchmark was found; write down when the clock starts and stops before comparing machines or vendors
MTTR is corrective maintenance time divided by repair actions. A 24-hour repair promise can hide a mean of 6 days once parts and travel delays are counted.
Go ifPlants that want shorter downtime events, with spares and skills as the levers
Skip ifYou lack timestamps for fault and restart; guessing makes the number useless
Why #8 over #9: It measures how fast stops end, which MTBF does not.
9
Labor Productivity (Manufacturing)
Photo: Siyuwj / CC BY-SA 3.0 via Wikimedia Commons
Answrs VerdictThe output-per-hour KPI.
Definition: Output per hour: an index of real output divided by an index of hours worked by all workers (BLS Productivity and Costs)Manufacturing sector, 2025: Labor productivity increased 1.9%, with output up 1.0%, hours worked down 0.9% and unit labor costs up 2.4% (BLS, March 24, 2026 revised release; read through a summarizing fetch tool)Durable and nondurable, 2025: Durable manufacturing productivity rose 2.7% and nondurable manufacturing 1.0% (BLS, March 24, 2026)By industry, 2025: Labor productivity increased in 39 of the 80 covered four-digit NAICS manufacturing industries (BLS, June 24, 2026)Benchmark: BLS measures labor, not equipment; use it to check that OEE gains show up as more output per hour
BLS reported manufacturing labor productivity up 1.9% in 2025, with output up 1.0% and hours down 0.9%.
Go ifExecutives checking whether equipment gains reach the bottom line
Skip ifYou need to find a bottleneck machine; this is a plant and sector measure
Why #9 over #10: It has government data behind it, which equipment metrics lack.
10
Six Big Losses and Changeover Time
Photo: The robotic engineer1 / CC BY-SA 4.0 via Wikimedia Commons
Answrs VerdictThe loss-hunting KPI.
Definition: OEE losses are subdivided into the “Six Big Losses” so that specific countermeasures can be applied to each (Wikipedia, OEE article)Origin: Vorne’s oee.com says Seiichi Nakajima led the introduction of TPM, OEE and the Six Big Losses in the early 1970sChangeovers: Setup and maintenance reduce OEE; Wikipedia notes this creates the incentive to shorten setups with SMED (single-minute exchange of die)TPM context: Total productive maintenance spreads responsibility for maintenance and machine performance to operators and others, with eight activities in company-wide TPMBenchmark: No public loss-category benchmark was found; log each stop under one reason code and review the largest losses weekly
The Six Big Losses split OEE losses into causes, and changeovers are one reason SMED exists. No public benchmark for loss categories was found.
Go ifPlants ready to turn an OEE number into a list of fixes
Skip ifYou have no stop-reason data yet; start with availability
How we ranked these
We ranked manufacturing KPIs on how directly they explain overall equipment effectiveness and how clearly a public source defines them, using Wikipedia’s OEE, MTBF, MTTR and TPM articles, Vorne’s oee.com, the NIST MEP Keats case study, the ISO 22400-2:2014 catalog entry, Federal Reserve G.17 capacity utilization and BLS productivity releases. Public OEE benchmarks do not exist, so each KPI says so and shows how to measure it. Facts are taken from each maker's own published information; check the official site before you buy.
Questions people ask
How is OEE calculated?
OEE is Availability times Performance times Quality. One worked example in Wikipedia’s OEE article uses 86.6%, 93% and 91.3% to give 73.6%.
What is a good OEE score?
The often-quoted 85% world-class figure is a convention tied to Seiichi Nakajima and TPM, not measured data; Vorne’s oee.com says most manufacturers are closer to 60%. No public survey was found.
What is the difference between OEE and TEEP?
OEE measures against scheduled time; TEEP multiplies OEE by the loading rate to measure against calendar time, where 100% means 24 hours a day and 365 days a year.
What is the capacity utilization rate for U.S. manufacturing?
The Federal Reserve’s preliminary rate for September 2026 was 75.9%, against a 1972-2025 average of 78.2%. It is a sector measure, not a plant OEE.
Capacity utilization by manufacturing industry group, September 2026 preliminary, % of capacity, seasonally adjusted (Federal Reserve G.17, released October 16, 2026) at a glance
Motor vehicles and parts67.8 % of capacity
Primary metals68 % of capacity
Chemicals72.3 % of capacity
Aerospace and misc. transportation equipment73.8 % of capacity
Computer and electronic products75.9 % of capacity
Food, beverage and tobacco products77.3 % of capacity
Fabricated metal products78.8 % of capacity
Machinery84.3 % of capacity
Electrical equipment, appliances and components86.9 % of capacity
Capacity utilization by manufacturing industry group, September 2026 preliminary, % of capacity, seasonally adjusted (Federal Reserve G.17, released October 16, 2026), as published by each maker. Picks without a published figure are left off.