ARPDAU is the top mobile gaming revenue KPI in 2027, followed by payer conversion and bookings per DAU. In Q2 2026 Playtika reported ARPDAU of $1.01 and payer conversion of 4.6%, while Adjust put day 1 retention for gaming apps at 27% in 2025. Where no published benchmark exists, this page says so.
Playtika counts a person who plays two games on one day as two DAUs, and applies the same rule to MAUs across a calendar month; it publishes both counts but no ratio
Portfolio publishers watching how often monthly players come back daily
Take-Two defines recurrent consumer spending as ongoing engagement revenue that includes virtual currency, add-on content, in-game purchases and in-game advertising
Investors and finance teams asking how much revenue sits outside the app stores and how much is recurring
ROAS targets are tied to cohort windows such as day 7, day 14 or day 28, depending on how fast users pay (Liftoff)
UA teams deciding whether a campaign has earned more budget
Pick by what you want
Best overall
ARPDAU
Best for payers
Mobile Game Payer Conversion
Best for retention
Mobile Game Day-1 Retention
Best for acquisition cost
Mobile Game Cost per Install
Best for revenue quality
Recurrent Spending and DTC Mix
The ranking
1
ARPDAU
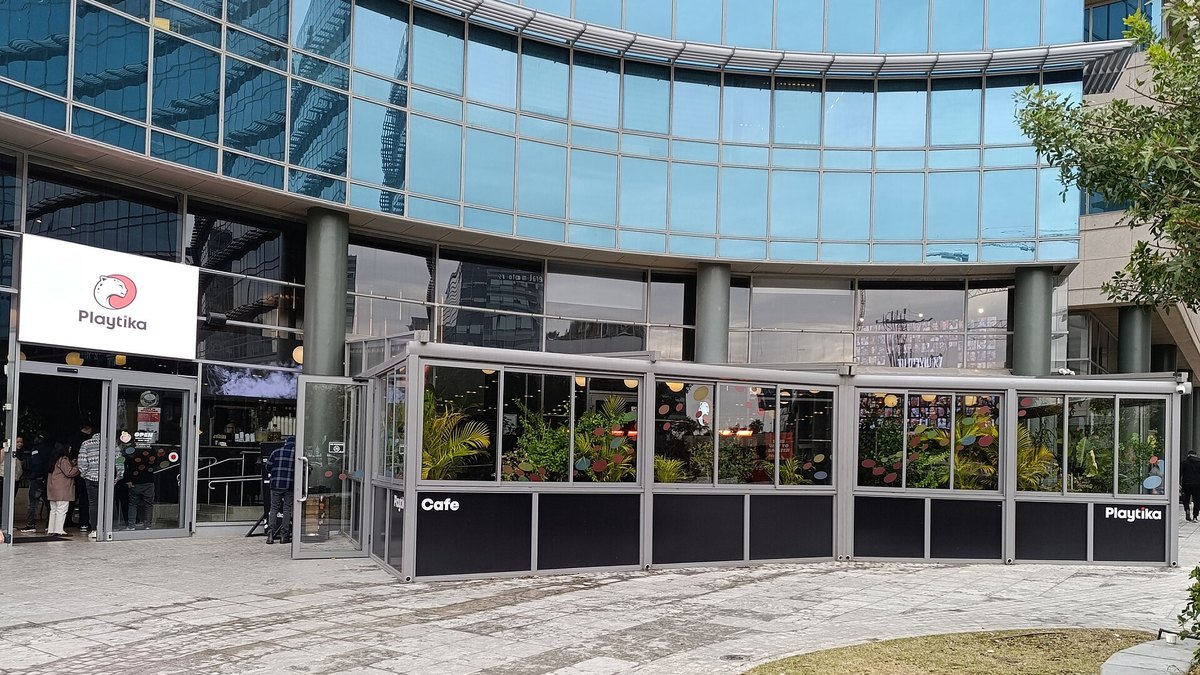
Photo: דוד שי / CC BY-SA 4.0 via Wikimedia Commons
Answrs VerdictThe headline KPI.
Definition: Total revenue in a period, divided by the number of days in that period, divided by the average daily active users (Playtika definition)Playtika, Q2 2026: ARPDAU of $1.01, versus $0.87 in Q2 2025Playtika, six months: $0.99 for the first half of 2026, versus $0.87 a year earlierOther publishers: Roblox reports bookings per DAU instead of ARPDAU; see the next pick
ARPDAU divides total revenue by days and by average daily active users. Playtika reported $1.01 for Q2 2026 against $0.87 in Q2 2025, and $0.99 for the first half of 2026.
Go ifFree-to-play studios comparing how much each daily player is worth
Skip ifYou need to know whether the revenue comes from many small payers or a few large ones
Why #1 over #2: It is the one number that joins audience and money, so it leads before the payer split behind it.
2
Mobile Game Payer Conversion
Photo: Marielle Velander / CC BY-SA 4.0 via Wikimedia Commons
Answrs VerdictThe payer-share KPI.
Definition: Daily paying users divided by daily active users on a given day; the period figure is the average of the daily rates (Playtika definition)Playtika, Q2 2026: Average daily payer conversion of 4.6%, versus 4.3% in Q2 2025Playtika, paying users: Average daily paying users of 367 thousand, versus 378 thousand in Q2 2025Roblox, Q2 2026: Average monthly unique payers of 27 million, up 15% year over year; this counts accounts that paid in a month, not a daily rate
Payer conversion is daily paying users divided by daily active users. Playtika reported 4.6% for Q2 2026 against 4.3% a year earlier, on 367 thousand average daily paying users, while Roblox reported 27 million average monthly unique payers.
Go ifGames that sell virtual currency or items to a small share of players
Skip ifYour game earns mainly from ads, where there are few payers to count
Why #2 over #3: It shows how much of ARPDAU rests on a small payer base, which bookings per DAU hides.
3
Bookings per DAU
Photo: 4300streetcar / CC BY 4.0 via Wikimedia Commons
Answrs VerdictThe platform KPI.
Definition: Bookings in a period divided by the DAUs for that period (Roblox definition, ABPDAU)Roblox, Q2 2026: Bookings growth of 8% year over year, at the low end of guidance; DAUs of 123 million, up 10%Roblox, stated driver: The shortfall reflects a decline in per hour monetization, most notably with younger cohorts in the U.S. and CanadaRoblox, engagement: Hours engaged of 29 billion, up 5% year over year
Roblox defines bookings per DAU as bookings divided by DAUs. For Q2 2026 it reported bookings growth of 8% and DAUs of 123 million, and blamed the shortfall on lower per hour monetization with younger cohorts in the U.S. and Canada.
Go ifPlatforms and publishers that book revenue before recognizing it
Skip ifYou report only recognized revenue per user, as ARPDAU does
Why #3 over #4: It suits platforms that book revenue up front, where retention only explains who stays.
4
Mobile Game Day-1 Retention
Photo: jennybento from Jackson Heights, usa / CC BY-SA 2.0 via Wikimedia Commons
Answrs VerdictThe first-impression KPI.
Definition: Day 1 retention rate for gaming apps, as measured by Adjust across the apps it tracks (data from January 2024 to January 2026)Adjust, 2025: Day 1 retention rate for all gaming apps was 27%, stable year over year; hybrid casual and hyper casual were both 27%Adjust, by genre: Family 23% (up from 18%), arcade 20% (up from 19%) and action 19% (up from 18%)GameAnalytics, 2025: Top 25% of games had day 1 retention just above 30% and the top 10% reached 40%, across 16,262 games with at least 1,000 MAU
Day 1 retention measures the first return visit. Adjust put it at 27% for all gaming apps in 2025, and GameAnalytics reported just above 30% for the top 25% of games and 40% for the top 10%.
Go ifTeams judging first-session quality and the tutorial
Skip ifYou only care about long-term payers, where day 30 is the better test
Why #4 over #5: It is the earliest read on game quality, which day 7 and day 30 retention confirm later.
5
Mobile Game Day-7 and Day-30 Retention
Photo: Roger Lew / CC BY 2.0 via Wikimedia Commons
Answrs VerdictThe staying-power KPI.
Definition: Share of players still active 7 and 30 days after install, as reported in the GameAnalytics 2026 mobile benchmarksGameAnalytics, day 7: Median day 7 retention just under 4%; top 25% at 6-7% and top 10% at 11-12%GameAnalytics, day 30: Median day 30 retention of 0.69%-0.79%; top 25% at 1.6%-1.8% and top 1% at 13-15%Caveat: GameAnalytics gives aggregated figures across all genres, and the page cited is a summary of its report
GameAnalytics reported median day 7 retention just under 4% and median day 30 retention of 0.69%-0.79%, with the top 1% at 13-15% on day 30. The source is a summary of the GameAnalytics report.
Go ifLive-ops teams checking whether events and content hold players beyond the first week
Skip ifYour game is new and has too few installs for a stable day 30 cohort
Why #5 over #6: It tests whether players stay past the first week, which stickiness cannot show on its own.
6
DAU to MAU Stickiness
Photo: Emriquet / CC BY 4.0 via Wikimedia Commons
Answrs VerdictThe habit KPI.
Definition: Playtika counts a person who plays two games on one day as two DAUs, and applies the same rule to MAUs across a calendar month; it publishes both counts but no ratioPlaytika DAUs, Q2 2026: Average DAUs of 8.0 million, versus 8.8 million in Q2 2025Playtika MAUs, Q2 2026: Average MAUs of 24.8 million, versus 30.0 million in Q2 2025Roblox, Q2 2026: DAUs of 123 million, up 10% year over year
Playtika reported average DAUs of 8.0 million and average MAUs of 24.8 million for Q2 2026, against 8.8 million and 30.0 million a year earlier. It does not publish a ratio, and neither do the other filings cited.
Go ifPortfolio publishers watching how often monthly players come back daily
Skip ifYou need a published industry ratio; none of the filings cited gives one
Why #6 over #7: It tracks the daily habit, where session length tracks depth within each visit.
7
Mobile Game Session Length
Photo: Klapi / CC BY-SA 4.0 via Wikimedia Commons
Answrs VerdictThe engagement KPI.
Definition: Roblox defines hours engaged as the aggregate of user session lengths in a periodGameAnalytics, per session: Top 25% of mobile games average about 5.2 minutes per session, the top 10% reach 8 minutes and the top 1% about 22 minutesGameAnalytics, per day: Top 25% see 22-24 minutes of daily play, the top 10% 40-42 minutes and the top 1% more than 94 minutesRoblox, Q2 2026: Hours engaged of 29 billion, up 5% year over year
Roblox defines hours engaged as the aggregate of user session lengths and reported 29 billion hours for Q2 2026. GameAnalytics reported about 5.2 minutes per session for the top 25% of games and 22-24 minutes of daily play.
Go ifTeams tuning ad frequency and energy systems around how long players stay
Skip ifYou need a median; the benchmark above gives only top-quartile and higher figures
Why #7 over #8: It shows how much time exists to monetize, which a revenue mix cannot show.
8
Recurrent Spending and DTC Mix
Photo: kawanet / CC BY 2.0 via Wikimedia Commons
Answrs VerdictThe revenue-quality KPI.
Definition: Take-Two defines recurrent consumer spending as ongoing engagement revenue that includes virtual currency, add-on content, in-game purchases and in-game advertisingTake-Two, Q1 fiscal 2027: Recurrent consumer spending was 84% of net bookings in the quarter ended June 30, 2026, and mobile was 53% of net bookings at $739.5 millionPlaytika, Q2 2026: Direct-to-consumer platforms brought $286.9 million of $731.1 million revenue, versus $175.9 million of $696.0 million a year earlierSensor Tower, 2025: Mobile game revenue rose 1% to $82 billion
Take-Two reported recurrent consumer spending at 84% of net bookings for the quarter ended June 30, 2026, with mobile at $739.5 million. Playtika reported $286.9 million of $731.1 million revenue through direct-to-consumer platforms.
Go ifInvestors and finance teams asking how much revenue sits outside the app stores and how much is recurring
Skip ifYou need an in-app purchase versus ads split; Take-Two reports them together
Why #8 over #9: It shows where revenue comes from and how recurring it is, which acquisition cost does not.
9
Mobile Game Cost per Install
Photo: Biswarup Ganguly / CC BY 3.0 via Wikimedia Commons
Answrs VerdictThe acquisition-cost KPI.
Definition: Cost per install (CPI) for gaming apps, as reported by Adjust from the apps it tracksAdjust, 2025: Global gaming CPI rose to $0.56, up 30% year over yearAdjust, regions: North America $1.68 (from $1.28), the U.S. $1.71 (from $1.31) and Europe $0.53 (from $0.36)Take-Two: Names player acquisition costs as a factor affecting its mobile business, but publishes no CPI figure
Adjust reported global gaming CPI of $0.56 in 2025, up 30% year over year, with North America at $1.68 and the U.S. at $1.71. Take-Two cites player acquisition costs as a factor in mobile but gives no CPI.
Go ifUA managers setting bids and checking payback assumptions
Skip ifYou need a genre-specific figure for your own game; the global average hides large gaps
Why #9 over #10: It prices the install, which ROAS then judges against revenue.
10
Mobile Game ROAS
Photo: Htm / CC BY-SA 4.0 via Wikimedia Commons
Answrs VerdictThe payback KPI.
Definition: ROAS targets are tied to cohort windows such as day 7, day 14 or day 28, depending on how fast users pay (Liftoff)Liftoff citing Segwise, day 7: Hyper-casual games about 7.6% on iOS and 7.8% on Android; mid-core about 4.3% on iOS and 6.1% on AndroidLiftoff citing Segwise, day 30: Casual games average 47% on iOS and 15% on AndroidPayback window: Ad-driven games generally need returns within 30 days; in-app-purchase games may take 90 to 180 days (Liftoff)
Liftoff, citing Segwise, reports day 7 ROAS of about 7.6% on iOS and 7.8% on Android for hyper-casual games, and day 30 ROAS of 47% on iOS and 15% on Android for casual games.
Go ifUA teams deciding whether a campaign has earned more budget
Skip ifYou measure too early; a short window makes in-app-purchase games look worse than they are
How we ranked these
We ranked KPIs on how directly they drive mobile game revenue and how clearly public sources define them, using the Playtika and Take-Two filings and the Roblox shareholder letter and 10-Q filed with the SEC, Adjust’s 2026 gaming app insights report, a summary of GameAnalytics’ 2026 benchmarks, Liftoff’s ROAS guide and Sensor Tower’s State of Gaming release. Each figure is labeled with whose it is and which period it covers. Facts are taken from each maker's own published information; check the official site before you buy.
Questions people ask
What is a good ARPDAU for a mobile game?
No filing sets a standard. Playtika reported ARPDAU of $1.01 for Q2 2026 against $0.87 a year earlier; that is one publisher, so it is a reference point rather than a benchmark.
What is a good Day-1 retention rate for a mobile game?
Adjust put day 1 retention for all gaming apps at 27% in 2025. GameAnalytics reported just above 30% for the top 25% of games and 40% for the top 10%.
What is a good Day-30 retention rate?
GameAnalytics reported a median of 0.69%-0.79%, 1.6%-1.8% for the top 25% and 13-15% for the top 1%. The page cited is a summary of the GameAnalytics report.
How do Playtika and Roblox measure revenue per user differently?
Playtika reports ARPDAU, total revenue divided by days divided by average DAUs. Roblox reports bookings per DAU, which divides bookings by DAUs for the period.
Day-1 retention, 2025 at a glance
Action games (Adjust)19 %
Arcade games (Adjust)20 %
Family games (Adjust)23 %
All gaming apps (Adjust)27 %
Top 10% of games (GameAnalytics)40 %
Day-1 retention, 2025, as published by each maker. Picks without a published figure are left off.