Top 10 Retail Shopping Center REIT Revenue KPIs in 2027
By Kory White · Updated Nov 2026 · 5 min read
Direct answer
Same-property NOI growth is the top revenue KPI for a retail shopping center REIT in 2027, followed by the leased occupancy rate and new-lease cash rent spreads. In the third quarter of 2026 Brixmor grew same property NOI 6.6% and Kimco 4.9%, Kimco reached a record 96.6% leased occupancy, and Brixmor signed new leases at a 42.6% rent spread. Where a REIT does not publish a KPI, this page says so.
Nareit defines net operating income as the income left from income-producing properties after all necessary operating expenses; the same-property version counts only centers owned for the whole of both periods compared
Investors and asset managers who want one number for how fast the existing centers are growing their income, before acquisitions and sales
Leased gross leasable area (GLA) as a percentage of total GLA, measured at the end of the period; Brixmor and Simon both define it on owned square footage
Leasing teams and investors: it shows how much of the space can earn rent, and how much room is left to grow by filling vacancies
The percentage change in contractual rent per square foot in the first year of a new lease against the last year of the old lease, for comparable space only (Brixmor definition)
Leasing and investment teams: it shows how far below market the old rents were, which is the pricing power a landlord has today
Annual base rent from leases that are signed but have not yet commenced, often shown as the gap between the leased rate and the occupied, billed or commenced rate
Analysts forecasting next year’s rent: this pipeline is income already signed that will start as tenants open
Nareit calls FFO the most commonly accepted and reported measure of REIT operating performance: net income excluding real estate depreciation and amortization, gains or losses on sales of certain real estate and related impairments
Shareholders: it is the earnings figure REITs guide to and the base for dividend coverage
Sales reported by retailers over the trailing 12 months, per square foot; Simon publishes it for its U.S. Malls and Premium Outlets
Mall and outlet landlords: tenant sales show whether retailers can afford higher rent at renewal
Pick by what you want
Best overall
Shopping Center REIT Same-Property NOI Growth
Best for space utilization
Shopping Center REIT Leased Occupancy Rate
Best for pricing power
Shopping Center REIT New-Lease Cash Rent Spread
Best for future revenue
Shopping Center REIT Signed-Not-Opened Pipeline
Best for shareholders
Shopping Center REIT Nareit FFO per Share
The ranking
1
Shopping Center REIT Same-Property NOI Growth
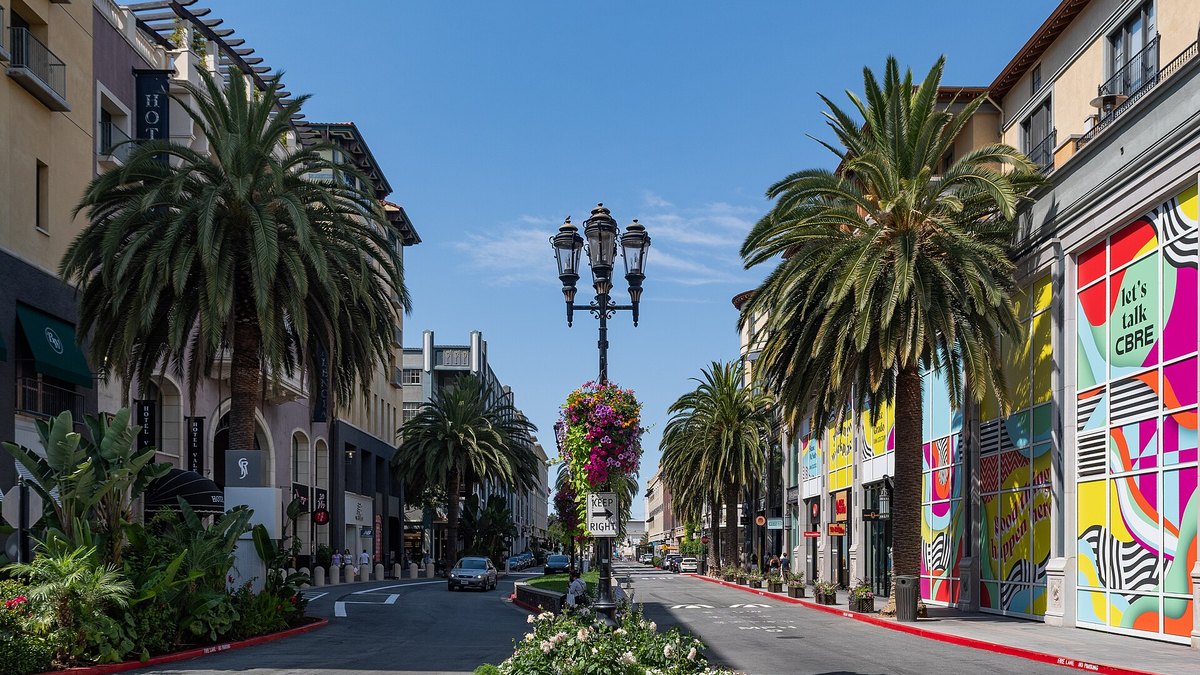
Photo: Steffen Schmitz (more photos) / CC BY-SA 4.0 via Wikimedia Commons
Answrs VerdictThe headline organic-growth KPI.
Formula: Nareit defines net operating income as the income left from income-producing properties after all necessary operating expenses; the same-property version counts only centers owned for the whole of both periods comparedBrixmor, third quarter 2026: Same property NOI up 6.6%, with base rent contributing 480 basis points; up 6.2% for the first nine months; 2026 guidance raised to 5.50% to 5.75%Kimco, third quarter 2026: Same property NOI up 4.9% year over year, driven by a 3.2% increase in minimum rents; credit loss was 45 basis points of total pro-rata rental revenuesRegency, second quarter 2026: Same Property NOI up 3.8%, with base rent growth contributing 3.7%; 2026 guidance raised to 3.7% to 4.1%Federal Realty, third quarter 2026: Comparable Property POI growth of 2.5%, or 4.0% on an adjusted basis that excludes straight-line rents and amortization of in-place leasesSimon, second quarter 2026: Domestic property NOI up 8.5% and portfolio NOI up 8.3% year over year
Same-property NOI growth measures income growth at centers owned in both periods. In the third quarter of 2026 Brixmor reported 6.6% and Kimco 4.9%, Regency reported 3.8% for the second quarter, and Federal Realty reported Comparable Property POI growth of 2.5%.
Go ifInvestors and asset managers who want one number for how fast the existing centers are growing their income, before acquisitions and sales
Skip ifYou compare REITs without reading their definitions: Federal Realty reports Comparable Property POI and Simon reports domestic property NOI rather than an identical measure
Why #1 over #2: It combines occupancy, rent and expense recovery in one growth rate, so it ranks above any single input.
2
Shopping Center REIT Leased Occupancy Rate
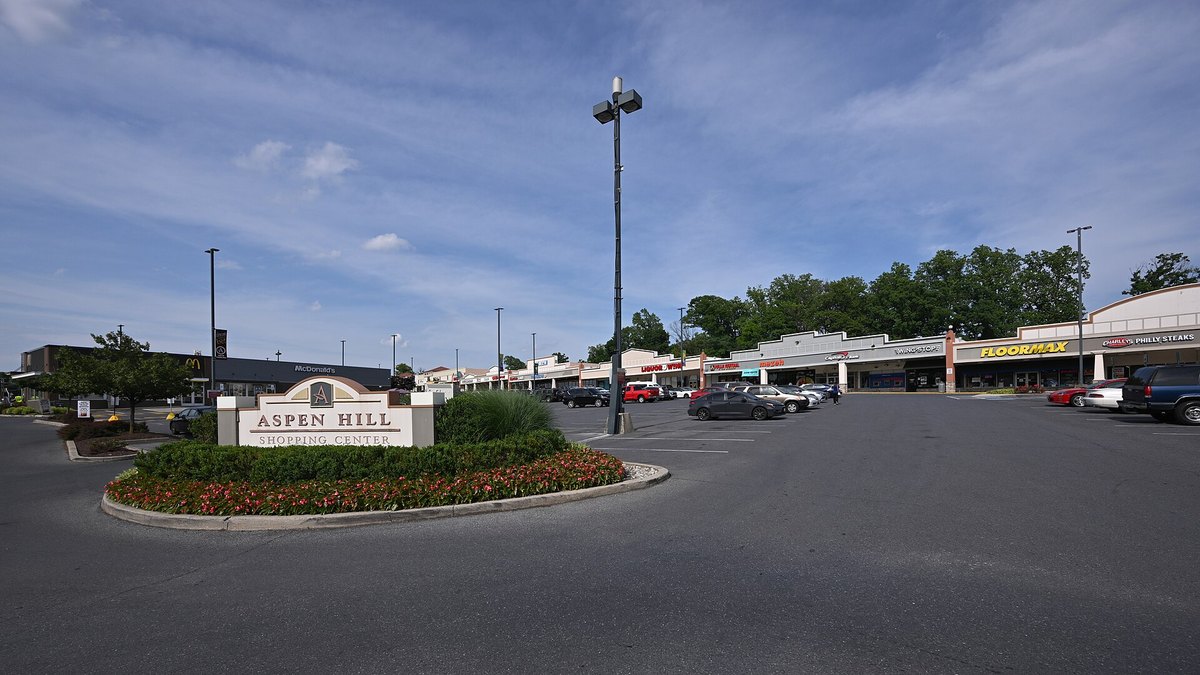
Photo: G. Edward Johnson / CC BY 4.0 via Wikimedia Commons
Answrs VerdictThe space-utilization KPI.
Formula: Leased gross leasable area (GLA) as a percentage of total GLA, measured at the end of the period; Brixmor and Simon both define it on owned square footageRegency, June 30, 2026: Same Property portfolio 96.9% leased, up 40 basis points year over yearKimco, September 30, 2026: Record 96.6% pro-rata leased occupancy, up 90 basis points year over yearFederal Realty, September 30, 2026: Portfolio leased rate of 96.5%, up 110 basis points year over year; occupancy of 93.8%Simon, June 30, 2026: U.S. Malls and Premium Outlets occupancy of 96.0%, unchanged from a year earlierBrixmor, September 30, 2026: Record total leased occupancy of 95.6%
Leased occupancy is leased space as a share of total space. Regency reported 96.9% at June 30, 2026, Kimco a record 96.6% and Federal Realty 96.5% at September 30, 2026, and Brixmor a record 95.6%.
Go ifLeasing teams and investors: it shows how much of the space can earn rent, and how much room is left to grow by filling vacancies
Skip ifYou need to know what is paying today: a leased rate includes signed leases that have not started paying rent
Why #2 over #3: Occupancy sets how much space can earn rent, which is the base every rent spread is applied to.
3
Shopping Center REIT New-Lease Cash Rent Spread
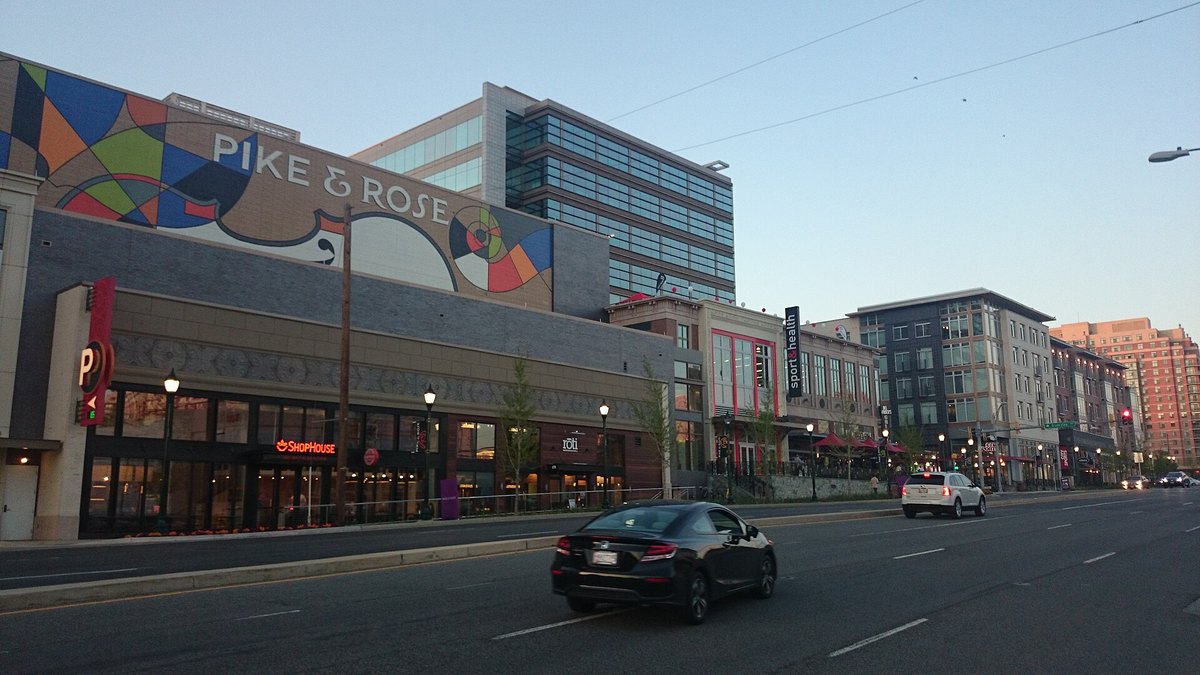
Photo: Payton Chung / CC BY 2.0 via Wikimedia Commons
Answrs VerdictThe pricing-power KPI.
Formula: The percentage change in contractual rent per square foot in the first year of a new lease against the last year of the old lease, for comparable space only (Brixmor definition)Brixmor, third quarter 2026: New lease rent spreads on comparable space of 42.6%Kimco, third quarter 2026: Pro-rata cash rent spreads of 31.5% on comparable new leasesFederal Realty, third quarter 2026: Comparable new leases at $39.15 per square foot against $32.72 prior rent: 20% on a cash basis and 32% straight-linedRegency, second quarter 2026: Comparable new leases at a 15.8% cash rent spread and 27.0% straight-lined; 19.3% cash for the twelve months ended June 30, 2026
The new-lease cash rent spread compares the first-year rent on a new lease with the last rent on the old one. In the third quarter of 2026 Brixmor reported 42.6%, Kimco 31.5% and Federal Realty 20% on a cash basis.
Go ifLeasing and investment teams: it shows how far below market the old rents were, which is the pricing power a landlord has today
Skip ifYou compare straight-lined spreads with cash spreads; straight-lined figures are always higher because they average in future rent bumps
Why #3 over #4: New leases show the market rent most clearly, so they rank above renewals as a pricing signal.
4
Shopping Center REIT Renewal Rent Spread and Retention
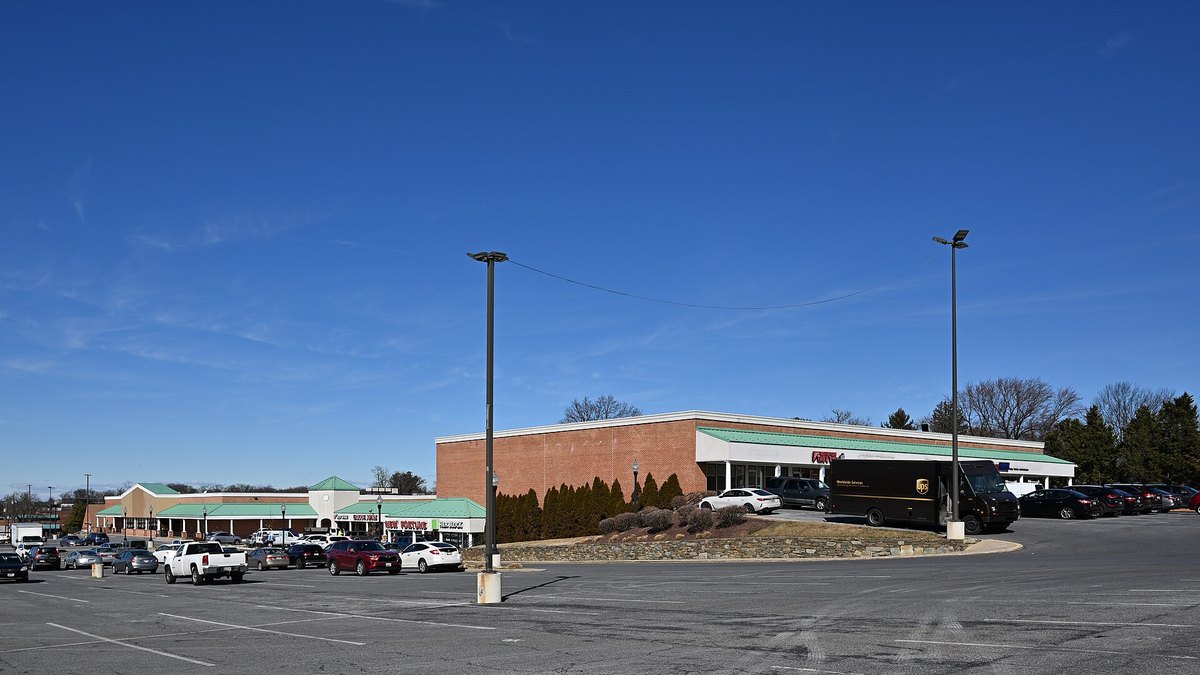
Photo: G. Edward Johnson / CC BY 4.0 via Wikimedia Commons
Answrs VerdictThe in-place rent growth KPI.
Formula: The same rent-spread calculation applied to renewals of existing tenants, read together with the share of expiring leases that renewBrixmor, third quarter 2026: Renewal lease rent spreads on comparable space of 19.4%; 25.3% blended across new and renewal leasesBrixmor retention: Lease retention rate at natural expiration of 79.9% by count and 88.1% by GLA for the twelve months ended September 30, 2026Regency, second quarter 2026: Comparable renewals at a 9.4% cash rent spread; 10.4% blended cash spread on new and renewal leasesKimco, third quarter 2026: Cash rent spreads of 7.3% on renewals and 7.7% on options; 12% blended on comparable spacesFederal Realty, third quarter 2026: Comparable renewals at $41.34 per square foot against $38.68 prior rent: 7% on a cash basis and 15% straight-lined
Renewal spreads show rent growth from tenants who stay. Brixmor reported 19.4% on renewals in the third quarter of 2026 and kept 88.1% of expiring space by GLA; Kimco reported 7.3% and Federal Realty 7% on a cash basis.
Go ifProperty managers: renewals are most of the leasing volume, so the renewal spread drives rent growth from tenants already in place
Skip ifYou want the market rent signal; new-lease spreads show it more clearly because renewals and options are partly set by the old lease
Why #4 over #5: Renewals cover more space than new leases, so they move total rent more than any other leasing figure below.
5
Shopping Center REIT Signed-Not-Opened Pipeline
Photo: G. Edward Johnson / CC BY 4.0 via Wikimedia Commons
Answrs VerdictThe built-in future revenue KPI.
Formula: Annual base rent from leases that are signed but have not yet commenced, often shown as the gap between the leased rate and the occupied, billed or commenced rateKimco, September 30, 2026: Leased versus economic occupancy spread of 390 basis points, representing $76 million in future rents from signed leases not yet commencedBrixmor, September 30, 2026: Leased to billed occupancy spread of 420 basis points; signed but not yet commenced new leases of 3.1 million square feet and $68.9 million of annualized base rentRegency, June 30, 2026: 308 leases signed not yet commenced on currently vacant space, 1,303 thousand square feet and $41,245 thousand of annual ABR, or $34.31 per square footFederal Realty, September 30, 2026: Portfolio 96.5% leased against 93.8% occupied
The signed-not-opened pipeline is rent already signed that has not started. Kimco reported $76 million at September 30, 2026, Brixmor $68.9 million of annualized base rent, and Regency $41,245 thousand at June 30, 2026.
Go ifAnalysts forecasting next year’s rent: this pipeline is income already signed that will start as tenants open
Skip ifYou add it to current revenue; none of it is paid until the tenant opens and rent commences
Why #5 over #6: It forecasts next year’s rent growth, which feeds FFO per share directly.
6
Shopping Center REIT Nareit FFO per Share
Photo: Midatii / CC BY-SA 4.0 via Wikimedia Commons
Answrs VerdictThe earnings KPI.
Formula: Nareit calls FFO the most commonly accepted and reported measure of REIT operating performance: net income excluding real estate depreciation and amortization, gains or losses on sales of certain real estate and related impairmentsFederal Realty, third quarter 2026: Nareit FFO of $1.87 per diluted share, up 5.6% year over year; 2026 guidance of $7.54 to $7.58Regency, second quarter 2026: Nareit FFO of $1.21 per diluted share; 2026 guidance raised to $4.84 to $4.88Brixmor, third quarter 2026: Nareit FFO of $0.60 per diluted share, versus $0.56; 2026 guidance of $2.36 to $2.38Kimco, third quarter 2026: FFO of $0.47 per diluted share, up 6.8%; 2026 guidance raised to $1.84 to $1.86Simon, second quarter 2026: FFO of $3.12 per diluted share; Real Estate FFO of $3.29, up 7.9%
Nareit FFO per share is the REIT earnings figure. Federal Realty reported $1.87 for the third quarter of 2026, Brixmor $0.60 and Kimco $0.47; Regency reported $1.21 for the second quarter.
Go ifShareholders: it is the earnings figure REITs guide to and the base for dividend coverage
Skip ifYou compare the dollar amount across REITs; share counts differ, so compare the growth rate instead
Why #6 over #7: It is the result of the revenue KPIs above rather than a driver, but it is the figure shareholders and guidance follow.
7
Shopping Center REIT ABR per Square Foot
Photo: Nielsoncaetanosalmeron / CC BY 4.0 via Wikimedia Commons
Answrs VerdictThe rent-level KPI.
Formula: Annualized base rent (contractual monthly base rent under signed or commenced leases, multiplied by 12) per square foot of GLA (Brixmor definitions)Brixmor, September 30, 2026: ABR per square foot of $19.47 on $1,084,149 thousand of ABR; $34.77 for spaces under 5,000 square feet against $12.32 for spaces of 35,000 square feet or moreRegency, June 30, 2026: ABR per square foot of $32.43 in California and $22.86 in Florida, its two largest statesFederal Realty, third quarter 2026: Comparable leases signed at an average rent of $40.01 per square foot, against $35.07 under prior leasesSimon, June 30, 2026: Base minimum rent of $62.42 per square foot at U.S. Malls and Premium Outlets, against $58.70 a year earlier, up 6.3%
ABR per square foot is the average rent level. Brixmor reported $19.47 at September 30, 2026, Regency $32.43 in California, and Simon a base minimum rent of $62.42 at its U.S. malls and outlets.
Go ifComparing rent levels across centers, markets and tenant sizes, and spotting where rents can rise
Skip ifYou compare grocery-anchored centers with malls directly; Simon’s mall and outlet rents sit far above open-air center rents
Why #7 over #8: It describes the rent level rather than its growth, so it ranks below the growth KPIs.
8
Shopping Center REIT Small-Shop Occupancy
Photo: Guylaen / CC0 via Wikimedia Commons
Answrs VerdictThe high-rent space KPI.
Formula: Leased rate for spaces under 10,000 square feet, reported separately from anchor spaces of 10,000 square feet or moreKimco, September 30, 2026: Small-shop occupancy at a record 92.9%; pro-rata anchor occupancy of 98.2%Brixmor, September 30, 2026: Small shop leased occupancy at a record 92.8%; anchor leased occupancy of 97.0%Regency, June 30, 2026: Same Property shop percent leased of 94.4%; anchor percent leased of 98.4%Federal Realty, September 30, 2026: Small shop leased rate of 94.1%, up 80 basis points year over year; anchor leased rate of 97.9%
Small-shop occupancy tracks spaces under 10,000 square feet. Kimco reported a record 92.9%, Brixmor a record 92.8% and Federal Realty 94.1% at September 30, 2026; Regency reported 94.4% at June 30, 2026.
Go ifLeasing teams: small shops pay the highest rent per square foot, so each point of small-shop occupancy is worth more revenue
Skip ifYou only track total occupancy; anchors can hold the total up while small-shop vacancy grows
Why #8 over #9: Small shops pay the most rent per square foot, so their occupancy is worth more than the recovery ratio below.
9
Shopping Center REIT Expense Recovery Ratio
Photo: DanTD / CC BY-SA 4.0 via Wikimedia Commons
Answrs VerdictThe cost pass-through KPI.
Formula: Expense reimbursements from tenants divided by operating costs plus real estate taxes (Brixmor definition)Brixmor, third quarter 2026: Same property expense recovery ratio of 95.3%, against 92.7% a year earlierBrixmor, total portfolio: Expense recovery ratio of 95.4% in the third quarter of 2026, against 91.7% a year earlierBrixmor, NOI margin: Same property NOI margin of 74.8% in the third quarter of 2026Regency, second quarter 2026: Same Property expense recovery ratio of 89.7%, against 88.1% a year earlier; NOI margin of 69.6%Kimco, Federal Realty and Simon: None found: the releases cited here do not publish an expense recovery ratio
The expense recovery ratio shows how much of operating costs and real estate taxes tenants pay back. Brixmor reported 95.3% for its same properties in the third quarter of 2026; Regency reported 89.7% for the second quarter.
Go ifAsset managers: it shows how much of the cost of running the center tenants pay back, which protects NOI when taxes and insurance rise
Skip ifYou need a peer set; only Brixmor and Regency publish it in the sources cited
Why #9 over #10: Only two of the five REITs cited publish it, but it still protects NOI more directly than tenant sales do.
10
Shopping Center REIT Tenant Sales per Square Foot
Photo: Fourc / CC BY-SA 4.0 via Wikimedia Commons
Answrs VerdictThe tenant health KPI.
Formula: Sales reported by retailers over the trailing 12 months, per square foot; Simon publishes it for its U.S. Malls and Premium OutletsSimon, June 30, 2026: Reported retailer sales per square foot of $838 for the trailing 12 months, against $736 a year earlier, up 13.9%Brixmor percentage rent: Same property percentage rents of $1,873 thousand in the third quarter of 2026, against $1,204 thousand; percentage rents depend on tenant sales volumesKimco, Regency, Federal Realty and Brixmor: None found: the releases cited here do not publish a tenant sales per square foot figure
Tenant sales per square foot shows whether retailers can afford their rent. Simon reported $838 for the twelve months ended June 30, 2026, up 13.9%; the open-air REITs cited here do not publish it.
Go ifMall and outlet landlords: tenant sales show whether retailers can afford higher rent at renewal
Skip ifYou own grocery-anchored strip centers; the open-air REITs cited here do not publish it, so it is hard to benchmark
How we ranked these
We ranked KPIs on how directly each one drives a shopping center REIT’s rental revenue and NOI and on how many of five large retail REITs publish it, using Kimco’s, Brixmor’s and Federal Realty’s third-quarter 2026 releases, Regency’s and Simon’s second-quarter 2026 releases and supplementals filed with the SEC, and Nareit’s glossary for the FFO and NOI definitions. REITs define some KPIs differently, so each figure names its company and period. Where none of the sources publishes a KPI, the page says so. Facts are taken from each maker's own published information; check the official site before you buy.
Questions people ask
What is the most important revenue KPI for a shopping center REIT?
Same-property NOI growth, because it shows how fast the existing centers grow their income. In the third quarter of 2026 Brixmor reported 6.6% and Kimco 4.9%; Regency reported 3.8% for the second quarter.
What is a good occupancy rate for a shopping center REIT?
The large open-air REITs reported leased rates between 95.6% (Brixmor) and 96.9% (Regency) in 2026. Kimco reported a record 96.6% and Federal Realty 96.5%.
What are leasing spreads?
The change in rent per square foot on a new or renewed lease against the old lease on the same space. In the third quarter of 2026 Brixmor reported 42.6% on new leases and 19.4% on renewals, and Kimco 31.5% on new leases and 7.3% on renewals, on a cash basis.
What does signed-not-opened mean for a REIT?
Rent from leases already signed where the tenant has not yet opened. Kimco reported $76 million of future rents from signed leases not yet commenced at September 30, 2026, and Brixmor reported $68.9 million of annualized base rent.
Leased occupancy, latest 2026 quarter end at a glance
Brixmor95.6 %
Simon96 %
Federal Realty96.5 %
Kimco96.6 %
Regency96.9 %
Leased occupancy, latest 2026 quarter end, as published by each maker. Picks without a published figure are left off.