Revenue growth is the top freight forwarding revenue KPI in 2027, followed by volume and revenue by service line. In Q3 2026 Expeditors reported revenues up 42%, C.H. Robinson Global Forwarding up 46.1% and Kuehne+Nagel net turnover up 22%, while DSV Air & Sea reported a 45.8% conversion ratio. Where a company did not publish a figure, this page says so.
Air freight weight shipped and ocean containers moved; DSV measures sea in TEUs (twenty-foot equivalent units) and air in tonnes of export cargo processed in its network
Forwarders and shippers separating volume growth from rate-driven revenue growth
How much of gross profit becomes operating profit; DSV calls it the conversion ratio and Kuehne+Nagel the conversion rate; Expeditors cites operating efficiency but its release does not define the term
Investors and operators testing whether revenue is turning into profit
Gross profit divided by units moved; C.H. Robinson reports per shipment, per metric ton and per transaction, and DSV reports per tonne of air freight and per TEU of sea freight
Pricing and yield teams, including those who track net revenue per TEU
Gross profit as a share of revenue; it falls when higher freight rates are passed through to customers
Analysts separating rate inflation from real margin change
Pick by what you want
Best overall
Freight Forwarding Revenue Growth
Best for volume
Freight Forwarding Volume: Air Tonnes and Ocean TEU
Best for profit
Freight Forwarding Operating Conversion
Best for yield
Freight Forwarding Gross Profit per Shipment, Tonne and TEU
Best for cash
Freight Forwarding Working Capital and Receivables
The ranking
1
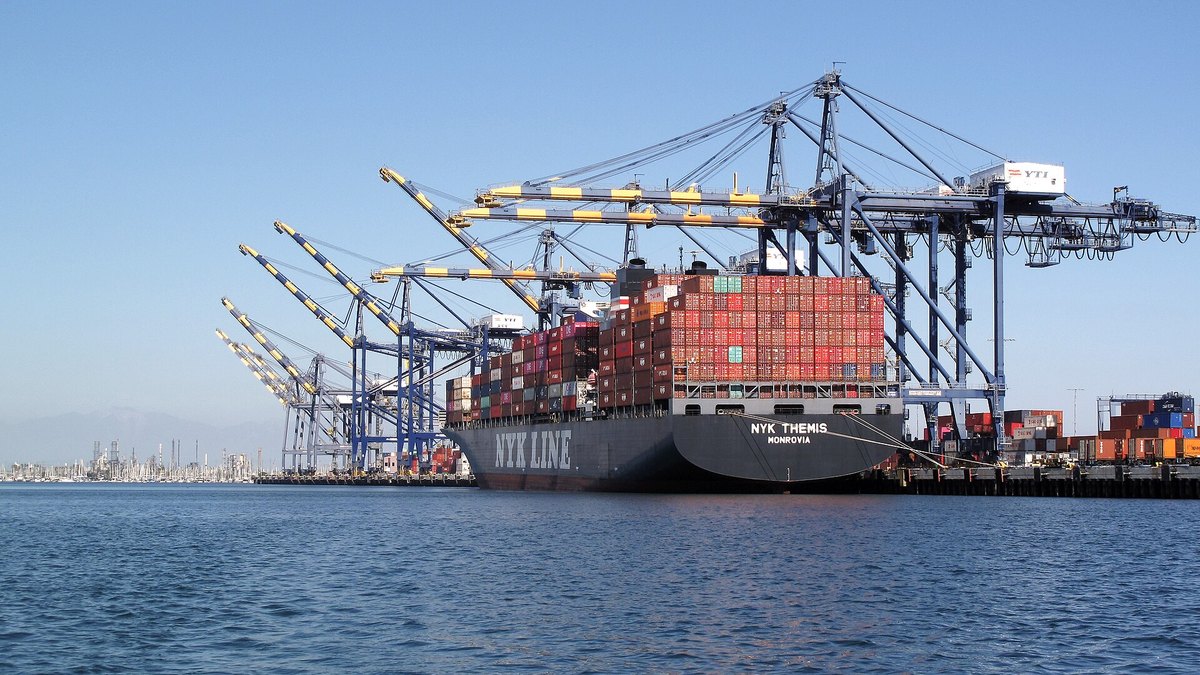
Freight Forwarding Revenue Growth
Photo: Downtowngal / CC BY-SA 4.0 via Wikimedia Commons
Answrs VerdictThe headline revenue KPI.
Definition: Revenue compared with the same quarter a year earlier; forwarders bill customers for freight, so higher rates raise revenue as well as higher volumeExpeditors (forwarder), Q3 2026: Revenues of $4,107,649 thousand versus $2,894,751 thousand, up 42%; nine months of $10,392,946 thousand, up 27%Kuehne+Nagel (forwarder), Q3 2026: Net turnover increased 22% to CHF 7.4 billionC.H. Robinson Global Forwarding, Q3 2026: Total revenues of $1,149,051 thousand versus $786,347 thousand, up 46.1%, primarily from higher pricing in ocean and air servicesDSV Air & Sea, Q3 2026: Divisional revenue of DKK 45,645 million versus DKK 38,688 million, up 15.9% in constant currencies, mainly from increased freight rates and surcharge recovery
Revenue growth is the headline number. Expeditors reported revenues up 42% in Q3 2026, C.H. Robinson Global Forwarding up 46.1% and Kuehne+Nagel net turnover up 22%, with higher freight rates a driver at several of them.
Go ifAnyone checking the top line of a forwarder against peers
Skip ifYou want profit quality; revenue includes pass-through freight cost
Why #1 over #2: All four forwarders publish it, where gross profit is published by two.
2
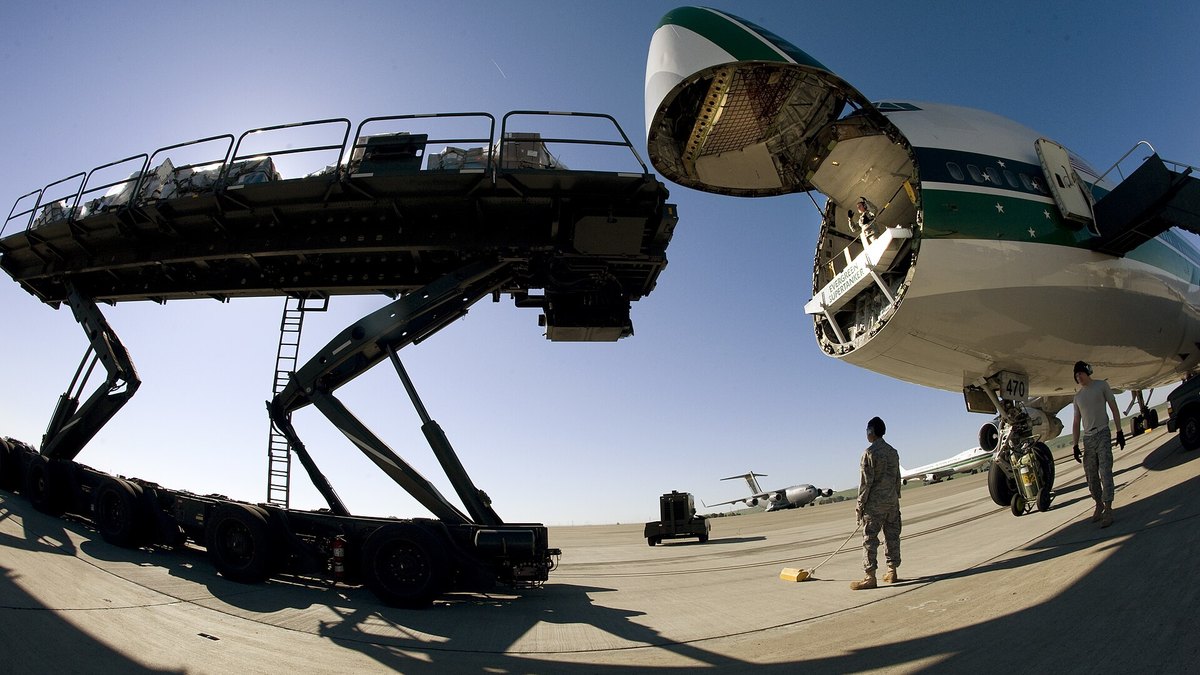
Freight Forwarding Volume: Air Tonnes and Ocean TEU
Photo: H. Zell / CC BY-SA 3.0 via Wikimedia Commons
Answrs VerdictThe volume KPI.
Definition: Air freight weight shipped and ocean containers moved; DSV measures sea in TEUs (twenty-foot equivalent units) and air in tonnes of export cargo processed in its networkExpeditors, Q3 2026: Airfreight kilos up 13% and ocean freight FEU up 7% for the quarter; by month airfreight was up 8%, 13% and 19% and ocean up 5%, 5% and 12%DSV Air & Sea, Q3 2026: Air volume of 560,890 tonnes versus 578,569 tonnes, down 3%; sea volume of 1,045,436 TEUs versus 1,072,808 TEUs, down 3%; first nine months up 15% in air and 13% in seaKuehne+Nagel, Q3 2026: Sea volumes up 5% in the quarter, 3.3 million TEU by the end of September 2026; air volume growth accelerated from 3% in Q2 2026 to 10% in Q3 2026, 1.7 million tonnes by the end of SeptemberC.H. Robinson Global Forwarding, Q3 2026: Ocean shipments up 2.0% and air metric tons shipped down 4.0%
Volume shows how much freight moved. Expeditors reported air kilos up 13% and ocean FEU up 7%, DSV reported air tonnes and sea TEUs each down 3%, and Kuehne+Nagel reported sea volumes up 5% and air volume growth of 10%.
Go ifForwarders and shippers separating volume growth from rate-driven revenue growth
Why #2 over #3: It separates volume from rates, where revenue growth blends them.
3
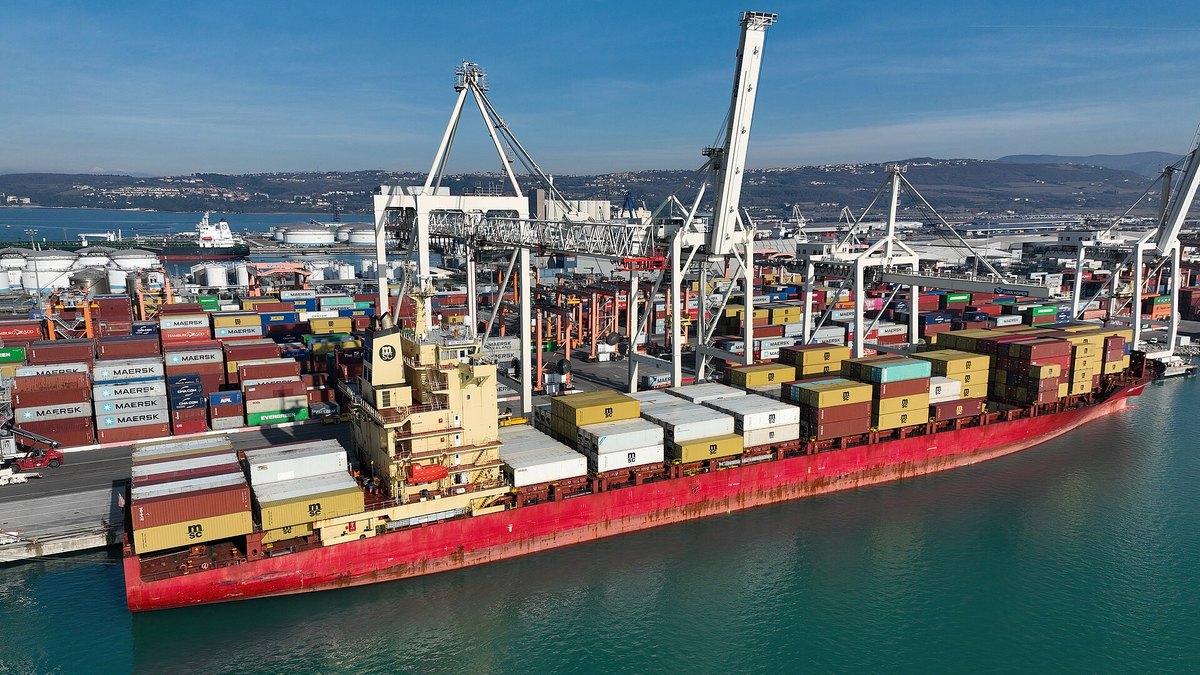
Freight Forwarding Revenue by Service Line
Photo: Lance Cheung / Public domain via Wikimedia Commons
Answrs VerdictThe mix KPI.
Definition: Revenue split among air, ocean, customs and other lines as each company reports itExpeditors, Q3 2026: Airfreight services $1,544,691 thousand versus $1,020,258 thousand; ocean freight and ocean services $1,102,833 thousand versus $746,120 thousand; customs brokerage and other services $1,460,125 thousand versus $1,128,373 thousandDSV Air & Sea, Q3 2026: Air freight revenue of DKK 24,569 million versus DKK 21,076 million; sea freight revenue of DKK 21,076 million versus DKK 17,612 millionKuehne+Nagel, Q3 2026: Net turnover: Sea Logistics up 20% to CHF 2.7 billion, Air Logistics up 38% to CHF 2.4 billion, Road Logistics up 14% to CHF 1 billion, Contract Logistics up 9% to CHF 1.3 billionC.H. Robinson Global Forwarding, Q3 2026: Publishes gross profit rather than revenue by line: ocean $136,086 thousand, up 23.2%; air $43,555 thousand, up 22.6%; customs $31,675 thousand, down 12.9%
Revenue by service line shows which lines carry growth. Expeditors reported airfreight revenue of $1,544,691 thousand, ocean of $1,102,833 thousand and customs brokerage and other of $1,460,125 thousand in Q3 2026.
Go ifOperators judging which lines are carrying growth
Skip ifYou need one comparable split; companies group lines differently
Why #3 over #4: It breaks the total apart, where volume covers only air and ocean.
4
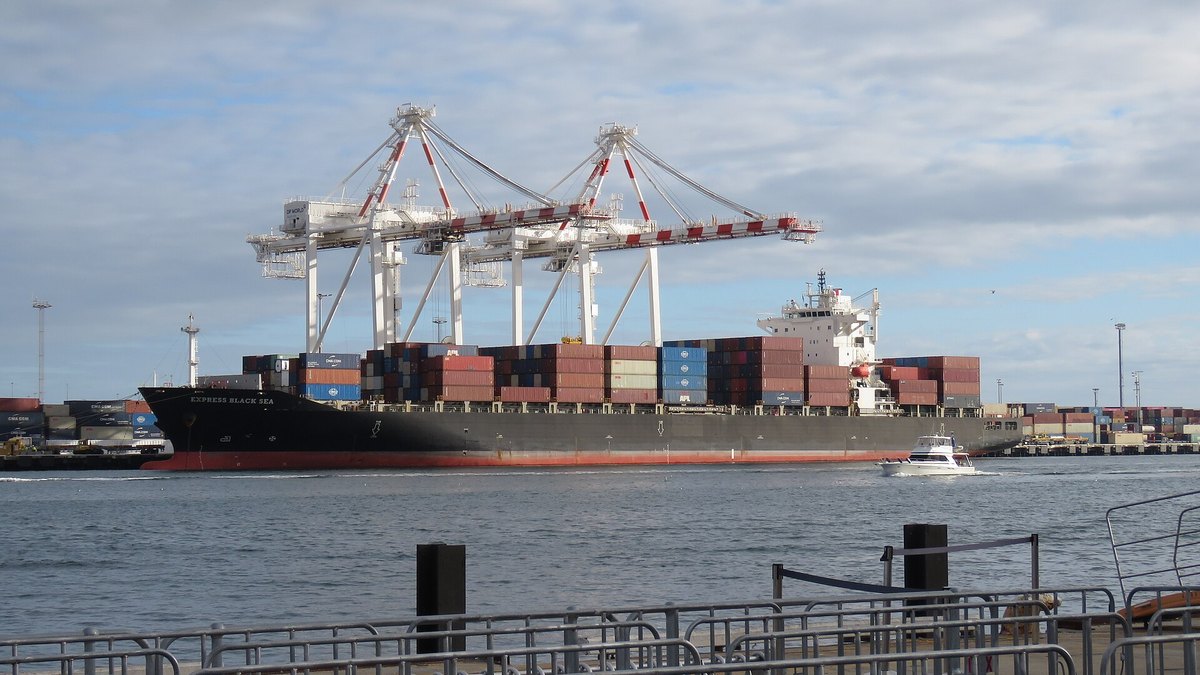
Freight Forwarding Operating Conversion
Photo: Petar Milošević / CC BY-SA 4.0 via Wikimedia Commons
Answrs VerdictThe profit-conversion KPI.
Definition: How much of gross profit becomes operating profit; DSV calls it the conversion ratio and Kuehne+Nagel the conversion rate; Expeditors cites operating efficiency but its release does not define the termDSV Air & Sea, Q3 2026: Conversion ratio of 45.8% versus 38.6% a year earlier and 42.4% in Q2 2026; EBIT before special items of DKK 4,278 million versus DKK 3,532 million; group conversion ratio of 32.6% versus 27.9%Kuehne+Nagel, Q3 2026: Conversion rate of 32% in Sea Logistics (EBIT CHF 172 million) and 32% in Air Logistics (EBIT CHF 169 million)Expeditors, Q3 2026: Operating income of $445,414 thousand versus $288,042 thousand, up 55%; operating efficiency of 36.7%, above its historical target of 30%C.H. Robinson Global Forwarding, Q3 2026: Income from operations of $80,047 thousand, up 63.3%; adjusted operating margin of 36.2%, or 36.6% excluding specified items
Operating conversion shows how much gross profit reaches operating profit. DSV Air & Sea reported a conversion ratio of 45.8% versus 38.6% a year earlier, and Kuehne+Nagel reported 32% in both Sea and Air Logistics.
Go ifInvestors and operators testing whether revenue is turning into profit
Skip ifYou compare firms directly; each defines the ratio its own way
Why #4 over #5: It shows profit quality, where the mix KPI shows only where revenue comes from.
5
Freight Forwarding Working Capital and Receivables
Photo: Axisadman / CC BY-SA 3.0 via Wikimedia Commons
Answrs VerdictThe cash KPI.
Definition: Cash tied up in unpaid freight bills; DSV reports net working capital (NWC) and Expeditors reports accounts receivableDSV, September 30, 2026: Air & Sea NWC of DKK 8,623 million versus DKK 5,498 million, higher on freight rates and fuel prices that raised receivables; group NWC of 3.4% of estimated full-year revenue versus 1.7% (pro forma) a year earlier, against a long-term expectation of around 2-3%Expeditors, September 30, 2026: Accounts receivable, less allowance, of $3,086,192 thousand versus $2,021,889 thousand at December 31, 2025C.H. Robinson, Q3 2026: Cash generated by operations decreased by $151.3 million to $124.1 million on unfavorable working-capital changes driven by higher transportation ratesDays sales outstanding: Not published: none of the releases read states days sales outstanding for forwarding, and this page does not compute one
Working capital shows the cash cost of high rates. DSV Air & Sea net working capital rose to DKK 8,623 million from DKK 5,498 million, and Expeditors accounts receivable were $3,086,192 thousand at September 30, 2026. Days sales outstanding was not published.
Go ifFinance teams watching how rate spikes strain cash
Skip ifYou need a days-outstanding figure; none was published
Why #5 over #6: It tracks cash, where conversion tracks accounting profit.
6
Freight Forwarding Gross Profit Growth
Photo: Calistemon / CC BY-SA 4.0 via Wikimedia Commons
Answrs VerdictThe gross profit KPI.
Definition: Revenue less the cost of buying freight and services; the margin a forwarder keeps on its billingsC.H. Robinson Global Forwarding, Q3 2026: Adjusted gross profits of $221,238 thousand versus $191,755 thousand, up 15.4%; nine months of $572,359 thousand, up 1.5%DSV Air & Sea, Q3 2026: Gross profit of DKK 9,342 million versus DKK 9,160 million, level in constant currencies; nine months of DKK 26,336 million versus DKK 24,019 million, up 10.2% in constant currenciesExpeditors and Kuehne+Nagel: Not published as a gross profit figure in the releases read; this page does not subtract costs to derive one
Gross profit growth strips out pass-through freight cost. C.H. Robinson Global Forwarding reported adjusted gross profits up 15.4% to $221,238 thousand, while DSV Air & Sea gross profit was DKK 9,342 million, level in constant currencies.
Go ifThose who want growth after pass-through freight cost is removed
Skip ifYou need all four companies; two publish it
Why #6 over #7: It removes the freight bill, where unit yield needs shipment counts.
7
Freight Forwarding Gross Profit per Shipment, Tonne and TEU
Photo: Goterrestrial / CC BY 4.0 via Wikimedia Commons
Answrs VerdictThe yield KPI.
Definition: Gross profit divided by units moved; C.H. Robinson reports per shipment, per metric ton and per transaction, and DSV reports per tonne of air freight and per TEU of sea freightC.H. Robinson Global Forwarding, Q3 2026: Ocean adjusted gross profit per shipment up 20.5%; air adjusted gross profit per metric ton shipped up 28.5%; customs adjusted gross profit per transaction down 13.0%DSV, Q3 2026: Air freight gross profit per tonne of DKK 8,936 versus DKK 8,196; sea freight gross profit per TEU of DKK 4,142 versus DKK 4,118Expeditors and Kuehne+Nagel: Not published per unit in the releases read
Unit yield shows what each shipment, tonne or TEU earns. C.H. Robinson reported ocean adjusted gross profit per shipment up 20.5%, and DSV reported sea gross profit per TEU of DKK 4,142 versus DKK 4,118.
Go ifPricing and yield teams, including those who track net revenue per TEU
Skip ifYou need dollars from every firm; C.H. Robinson published percentages only
Why #7 over #8: It measures yield per unit, where customs revenue measures one add-on line.
8
Freight Forwarding Customs Brokerage Revenue
Photo: CBP Photography / Public domain via Wikimedia Commons
Answrs VerdictThe ancillary revenue KPI.
Definition: Revenue from clearing shipments through customs, a service forwarders sell alongside air and ocean freightExpeditors, Q3 2026: Customs brokerage and other services revenue of $1,460,125 thousand versus $1,128,373 thousand; every product in the line grew double digitsExpeditors growth drivers: Tariff-related additional-line fees and post-entry activity that began in Q3 2025, plus new business wins and higher declaration volumesC.H. Robinson, Q3 2026: Customs adjusted gross profits of $31,675 thousand, down 12.9%, on a 13.0% decrease in adjusted gross profit per transaction
Customs brokerage is a revenue line beside freight. Expeditors reported customs brokerage and other services revenue of $1,460,125 thousand in Q3 2026, with double-digit growth in every product, while C.H. Robinson customs gross profits fell 12.9%.
Go ifForwarders weighing ancillary revenue against freight revenue
Skip ifYour lines are air and ocean only
Why #8 over #9: It is a published revenue line at Expeditors, where revenue per employee is not published.
9
Freight Forwarding Revenue per Employee
Photo: TrainLearnGrow / CC BY-SA 4.0 via Wikimedia Commons
Answrs VerdictThe productivity KPI.
Definition: Revenue relative to staff; no company in the releases read published a revenue-per-employee figureExpeditors, Q3 2026: Revenue grew 42% while headcount increased only 1%; full-time equivalents of 20,463 versus 20,170 at September 30C.H. Robinson Global Forwarding, Q3 2026: Third quarter average employee headcount decreased 15.8% year over year while revenues increased 46.1%Kuehne+Nagel Contract Logistics, Q3 2026: New customer projects required the recruitment of around 4,000 additional employees
Revenue per employee tests productivity. No company published the ratio, but Expeditors grew revenue 42% on 1% more headcount and C.H. Robinson Global Forwarding cut average headcount 15.8% while revenues rose 46.1%.
Go ifOperators checking whether automation is decoupling headcount from revenue
Skip ifYou need a ratio; none is published and this page does not compute one
Why #9 over #10: Two forwarders disclose the inputs, where gross margin was published by one.
10
Freight Forwarding Gross Margin
Photo: Lee Ann Ratledge / CC BY 4.0 via Wikimedia Commons
Answrs VerdictThe margin KPI.
Definition: Gross profit as a share of revenue; it falls when higher freight rates are passed through to customersDSV Air & Sea, Q3 2026: Gross profit margin of 20.5% versus 23.7% a year earlier, declining on pass-through of increased freight rates and fuel pricesDSV by mode, Q3 2026: Air freight gross margin of 20.4% versus 22.5%; sea freight gross margin of 20.5% versus 25.1%Other forwarders: Not published as a gross margin in the releases read
Gross margin shows the pass-through effect. DSV Air & Sea reported a gross profit margin of 20.5% versus 23.7% a year earlier, with air at 20.4% and sea at 20.5%. The other forwarders did not publish one.
Go ifAnalysts separating rate inflation from real margin change
Skip ifYou need cross-company data; only DSV published it in the releases read
How we ranked these
We ranked ten freight forwarding revenue KPIs by how many of four forwarders published a figure for them in third quarter 2026 releases, then by how directly each measures revenue. The four are Expeditors (released in early November 2026), DSV and Kuehne+Nagel (released in late October 2026; Kuehne+Nagel read through news coverage of its release) and C.H. Robinson (late October 2026, Global Forwarding segment). DHL Global Forwarding is not covered because its release could not be loaded. Figures are in different currencies and defined differently, so they are not strictly comparable. Where no number is published we say so instead of estimating. Facts are taken from each maker's own published information; check the official site before you buy.
Questions people ask
How fast did freight forwarder revenue grow in Q3 2026?
Expeditors reported revenues up 42%, C.H. Robinson Global Forwarding up 46.1% and Kuehne+Nagel net turnover up 22%. DSV Air & Sea revenue was up 15.9% in constant currencies.
Why did revenue grow faster than volume?
Rates. C.H. Robinson attributed Global Forwarding revenue growth primarily to higher pricing in ocean and air services, and DSV cited increased freight rates and surcharge recovery, while DSV air tonnes and sea TEUs each fell 3%.
What is a conversion ratio in freight forwarding?
DSV and Kuehne+Nagel report how much gross profit becomes operating profit. DSV Air & Sea reported 45.8% in Q3 2026 versus 38.6% a year earlier, and Kuehne+Nagel reported 32% in both Sea and Air Logistics.
What is gross profit per TEU?
DSV reported sea freight gross profit per TEU of DKK 4,142 in Q3 2026 versus DKK 4,118 a year earlier.
Revenue growth, Q3 2026 versus Q3 2025, percent (bases differ by company) at a glance