Top 10 Sales KPIs in the Commercial Pharmaceutical Sales Industry in 2027
By Kory White · Updated Oct 2026 · 5 min read
Direct answer
Total prescription (TRx) share is the top sales KPI in commercial pharma in 2027, followed by new-to-brand (NBRx) share and revenue growth. Novo Nordisk reported a 43% share of total monthly prescriptions and around 40% new-to-brand share in its US GLP-1 diabetes class in Q4 2025. Where no source publishes a benchmark, this page says so.
Selling, general and administrative (SG&A) spending, reported in dollars, which includes sales force, marketing and promotion
Finance and commercial leaders weighing spend against growth
Pick by what you want
Best overall
Pharma TRx Market Share
Best for launches
Pharma NBRx Market Share
Best for field force
Pharma Call Reach and Frequency
Best for payers
Pharma Formulary Coverage
Best for pricing
Pharma Net Price and Gross-to-Net
The ranking
1
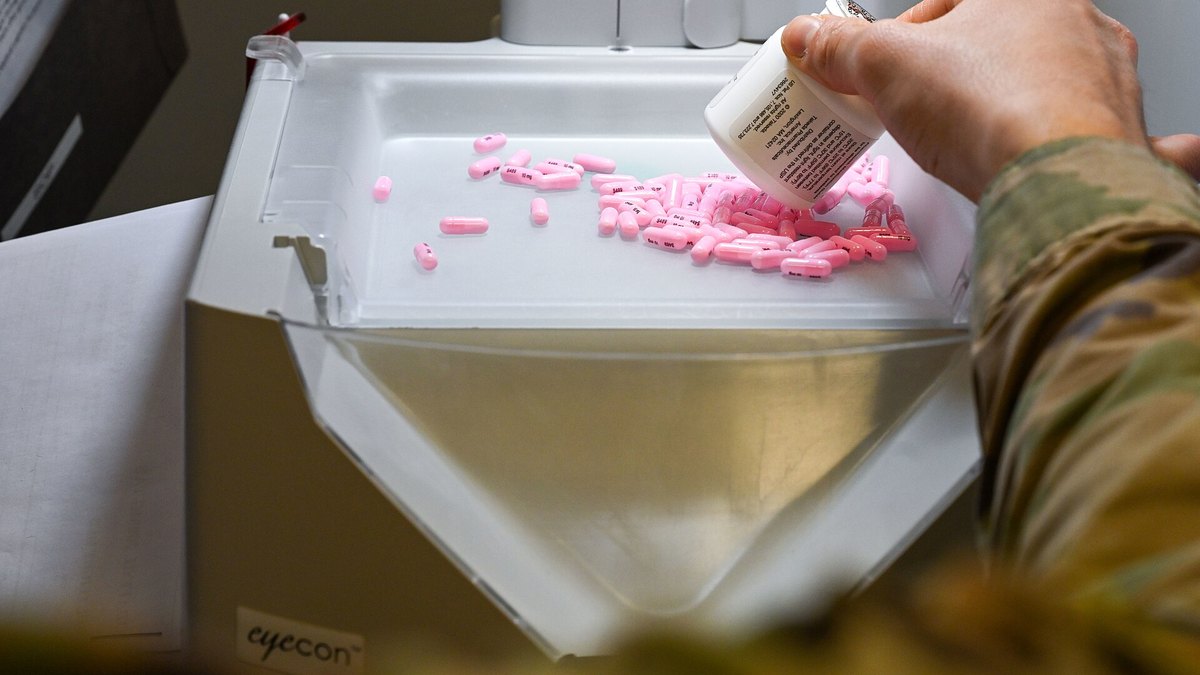
Pharma TRx Market Share
Photo: U.S. Air Force photo by Senior Airman Jessica Sanchez-Chen / Public domain via Wikimedia Commons
Answrs VerdictThe headline sales KPI.
Definition: Share of total prescriptions (TRx) a brand or company holds in its classNovo Nordisk benchmark: US GLP-1 diabetes class: Novo Nordisk share of total monthly prescriptions was 43% in the fourth quarter of 2025, with a 45.7% value market shareClass context: GLP-1 share of total US diabetes prescriptions increased to 20.0%, versus 17.9% 12 months earlierEli Lilly: The Lilly 10-K and Q4 2025 release cited here state no TRx share percentage
TRx share is the share of total prescriptions a product holds in its class. Novo Nordisk reported 43% of total monthly prescriptions in the US GLP-1 diabetes class in Q4 2025 and a 45.7% value market share. Eli Lilly's 10-K and Q4 2025 release publish no TRx percentage.
Go ifBrand teams tracking whether prescribing is moving toward or away from their product
Skip ifYou need a number for a product whose maker does not publish its share
Why #1 over #2: It measures what physicians actually prescribe, which revenue growth only shows after the fact.
2
Pharma NBRx Market Share
Photo: Shixart1985 / CC BY 2.0 via Wikimedia Commons
Answrs VerdictThe leading-indicator KPI.
Definition: Share of new-to-brand prescriptions (NBRx) written for a product, which shows which brand physicians start patients onNovo Nordisk benchmark: US GLP-1 diabetes class: share of new-to-brand prescriptions has stabilised to around 40% (Q4 2025)Same class, total prescriptions: Novo Nordisk share of total monthly prescriptions was 43%, so NBRx and TRx can differEli Lilly: No NBRx share percentage in the Lilly 10-K or Q4 2025 release cited here
NBRx share counts new-to-brand prescriptions, the first scripts that start a patient on a product. Novo Nordisk reported its share has stabilised to around 40% in the US GLP-1 diabetes class, against 43% of total prescriptions.
Go ifLaunch teams and anyone judging momentum before total prescriptions catch up
Skip ifYour product is in a mature class with few new patient starts
Why #2 over #3: It moves before TRx does, so it shows launch momentum earlier.
3
Pharma Revenue Growth
Photo: Пресс-центр Правительства Тульской области. / CC BY 4.0 via Wikimedia Commons
Answrs VerdictThe top-line KPI.
Definition: Year-over-year change in total revenuesEli Lilly benchmark: Revenue of $65,179 million in 2025, versus $45,043 million in 2024, up 45%Merck benchmark: Worldwide sales of $65,011 million in 2025, up 1%, versus $64,168 million in 2024Pfizer and Bristol Myers Squibb: Pfizer total revenues decreased 2% to $62.6 billion in 2025; Bristol Myers Squibb total revenues were $48,194 million, versus $48,300 million, described as relatively flat
Revenue growth is the year-over-year change in total revenues. Eli Lilly reported $65,179 million in 2025, up 45%, Merck $65,011 million, up 1%, and Bristol Myers Squibb $48,194 million, described as relatively flat.
Go ifExecutives checking whether commercial execution is outpacing the market
Skip ifYou need to separate volume from price, which the later KPIs do
Why #3 over #4: It is the plain top-line check, though it hides whether growth came from volume or price.
4
Pharma HCP Access Rate
Photo: Infrogmation / CC BY-SA 4.0 via Wikimedia Commons
Answrs VerdictThe access KPI.
Definition: Share of healthcare providers (HCPs) a sales team can actually reach in person; ZS publishes it as AccessMonitor dataOncology benchmark: In oncology, 68% of the universe is access restricted and 32% of providers are fully accessible (ZS Access Monitor; the page shows no date)Historic all-specialty benchmark: 53% of US physicians placed moderate-to-severe restrictions on sales rep visits in 2015, versus 49% in 2014 (ZS AccessMonitor, reported September 2015)Current all-specialty figure: No current all-specialty percentage was found in a source we could read
HCP access rate is the share of providers a sales team can reach in person. ZS Access Monitor data show 68% of the oncology universe is access restricted, and ZS reported 53% of US physicians placed moderate-to-severe restrictions on rep visits in 2015. No current all-specialty figure was confirmed.
Go ifSales leaders deciding which accounts reps can still reach
Skip ifYou need a current all-specialty number, which is not publicly confirmed
Why #4 over #5: It explains why call volume does not turn into prescriptions, which share KPIs cannot.
5
Pharma Call Reach and Frequency
Photo: Unknown photographer / Public domain via Wikimedia Commons
Answrs VerdictThe field-activity KPI.
Definition: Reach is the share of target HCPs called on; frequency is how many times each is detailed in a yearOncology frequency benchmark: Only 5% of oncologists were detailed at least 12 times annually, down from closer to 20% a decade earlier (ZS Access Monitor)Rep touchpoints: A ZS study of 25,000-plus physicians found providers experience an average of nine face-to-face sales rep touchpoints every day, with some targeted providers far exceeding thatCross-industry benchmark: No public industry-wide reach or frequency standard was found
Call reach and frequency track how many target HCPs are called on and how often. ZS reported only 5% of oncologists were detailed at least 12 times annually, down from closer to 20% a decade earlier. No industry-wide standard is published.
Go ifField force planners setting call plans by specialty
Skip ifYou judge reps on activity alone, since more calls do not equal more access
Why #5 over #6: It measures field effort directly, which access alone does not.
6
Pharma Formulary Coverage
Photo: Mike1979 Russia / CC BY-SA 3.0 via Wikimedia Commons
Answrs VerdictThe payer-access KPI.
Definition: Whether payers and PBMs list a drug on formulary, and at what tier and restriction levelPBM exclusions benchmark: Each of the three largest PBM exclusion lists for 2026 contains more than 600 products (Drug Channels, January 22, 2026)Eli Lilly: Competes for formulary placement on attributes and by providing rebates or other concessions; unfavorable placement can reduce usageBristol Myers Squibb: Has been generally, although not universally, successful in having major products included on MCO and PBM formularies
Formulary coverage shows whether payers and PBMs list a drug and on what terms. Drug Channels reported each of the three largest PBM exclusion lists for 2026 contains more than 600 products. Companies do not publish covered-lives percentages in the filings cited.
Go ifMarket access and account teams negotiating with payers and PBMs
Skip ifYou need a covered-lives percentage, which companies do not publish in these filings
Why #6 over #7: It decides whether a prescription can be filled at an affordable cost, which call KPIs ignore.
7
Pharma Net Price and Gross-to-Net
Photo: Airman 1st Class Rachel Loftis / Public domain via Wikimedia Commons
Answrs VerdictThe price-realization KPI.
Definition: Net price is list price minus rebates, discounts and fees; the gross-to-net (GTN) gap is that total deductionIndustry benchmark: Brand-name average list prices grew 3.5% in 2025 while nominal net prices decreased 0.7% through the first three quarters of 2025; the total 2024 gross-to-net reduction was $356 billion (Drug Channels)Bristol Myers Squibb: Average net selling prices decreased by 4% in 2025 compared to 2024Eli Lilly: Lower realized prices offset part of 2025 volume growth: price was down 6% worldwide and down 10% in the US
Net price and gross-to-net track what a manufacturer actually keeps after rebates. Drug Channels reported brand-name list prices up 3.5% in 2025 while nominal net prices decreased 0.7% through the first three quarters, and Bristol Myers Squibb reported average net selling prices down 4%.
Go ifBrand and finance teams who must price against payer rebates
Skip ifYou cannot see rebate data and only know list price
Why #7 over #8: It reveals price erosion that revenue growth hides when volume is rising.
8
Pharma Sales Volume Growth
Photo: Bart Everson / CC BY 2.0 via Wikimedia Commons
Answrs VerdictThe demand KPI.
Definition: Change in units sold, separated from the change in realized priceEli Lilly 2025: Worldwide volume up 50% and price down 6% in 2025; US volume up 53% and price down 10%Eli Lilly Q2 2026: Worldwide revenue up 48% to $23.0 billion, driven by a 60% increase in volume, partially offset by a 13% decrease in realized prices (release of August 5, 2026)Eli Lilly Q4 2025: US revenue up 43% to $12.9 billion, driven by a 50% increase in volume, partially offset by a 7% decrease from lower realized prices
Sales volume growth separates units from price. Eli Lilly reported worldwide volume up 50% and price down 6% in 2025, and in Q2 2026 a 60% volume increase partly offset by a 13% decrease in realized prices.
Go ifAnalysts separating demand from pricing in a year of heavy rebating
Skip ifYour company does not disclose a price and volume split
Why #8 over #9: It shows demand directly, where net price shows only the price side.
9
Pharma New Product Launch Revenue
Photo: Raimond Spekking / CC BY-SA 4.0 via Wikimedia Commons
Answrs VerdictThe growth-pipeline KPI.
Definition: Revenue from recently launched products, tracked against prior-year revenueMerck benchmark: Winrevair sales were $1,443 million in 2025, versus $419 million in 2024; Capvaxive $759 million, versus $97 millionBristol Myers Squibb benchmark: Total Growth Portfolio revenue of $26,409 million in 2025, versus $22,563 million, up 17%; Opdivo Qvantig $238 millionMerck concentration: Sales of Keytruda represented 49% of the Company's total sales in 2025
New product launch revenue tracks recently launched products. Merck reported Winrevair sales of $1,443 million in 2025, versus $419 million in 2024, and Bristol Myers Squibb reported Growth Portfolio revenue of $26,409 million, up 17%.
Go ifCompanies replacing revenue from products losing exclusivity
Skip ifYour portfolio has no recent launches
Why #9 over #10: It shows how fast the portfolio is renewing, which total growth blends with older products.
10
Pharma Selling Cost
Photo: Shixart1985 / CC BY 2.0 via Wikimedia Commons
Answrs VerdictThe efficiency KPI.
Definition: Selling, general and administrative (SG&A) spending, reported in dollars, which includes sales force, marketing and promotionEli Lilly benchmark: Marketing, selling and administrative expenses of $11,094 million in 2025, versus $8,594 million in 2024, up 29%, driven by promotional efforts supporting launchesPfizer benchmark: Selling, informational and administrative expenses of $13,794 million in 2025, versus $14,730 million in 2024, down 6%Merck and Bristol Myers Squibb: Merck SG&A of $10,733 million in 2025, down 1%; Bristol Myers Squibb SG&A of $7,267 million, versus $8,414 million, down 14%
Selling cost is SG&A spending, reported in dollars. Pfizer reported $13,794 million in 2025, Eli Lilly $11,094 million, up 29%, Merck $10,733 million and Bristol Myers Squibb $7,267 million, down 14%. No cost-per-rep figure is published.
Go ifFinance and commercial leaders weighing spend against growth
Skip ifYou need cost per rep or per call, which companies do not publish
How we ranked these
We ranked commercial pharma sales KPIs on how directly they show sales health and how clearly company filings and industry sources define them, using the Eli Lilly, Pfizer, Merck and Bristol Myers Squibb 10-Ks, Lilly earnings releases, Novo Nordisk's FY2025 report, Drug Channels and ZS. We cite a benchmark only where a source states one, and say so where none was found. Companies define and disclose these measures differently, so cross-company comparisons are approximate. Facts are taken from each maker's own published information; check the official site before you buy.
Questions people ask
What is the most important sales KPI in commercial pharma?
Total prescription (TRx) share is the headline KPI. Novo Nordisk reported a 43% share of total monthly prescriptions in the US GLP-1 diabetes class in Q4 2025, with new-to-brand share around 40%.
What is the difference between TRx and NBRx?
TRx counts all prescriptions filled, while NBRx counts new-to-brand prescriptions that start a patient on a product. Novo Nordisk reported 43% TRx share and around 40% NBRx share in its US GLP-1 diabetes class.
How accessible are physicians to pharma sales reps?
ZS Access Monitor data show 68% of the oncology universe is access restricted and 32% fully accessible. For all specialties, ZS reported 53% of US physicians placed moderate-to-severe restrictions in 2015; no current all-specialty figure was confirmed.
How many drugs do PBMs exclude from formularies?
Drug Channels reported that each of the three largest PBM exclusion lists for 2026 contains more than 600 products.
Selling, general and administrative expense, 2025, $ million at a glance
Bristol Myers Squibb7,267 $ million
Merck10,733 $ million
Eli Lilly11,094 $ million
Pfizer13,794 $ million
Selling, general and administrative expense, 2025, $ million, as published by each maker. Picks without a published figure are left off.