Top 10 Sales KPIs in the Cruise Line Industry in 2027
By Kory White · Updated Oct 2026 · 4 min read
Direct answer
Net Yield is the top sales KPI for a cruise line in 2027, followed by occupancy and onboard revenue share. Royal Caribbean reported Net Yields up 3.8% as-reported in 2025, and Carnival reported net yields up 2.4% in constant currency in Q3 fiscal 2026. Where no source publishes a benchmark, this page says so.
Net Yield is Adjusted Gross Margin per Capacity Day (Norwegian Cruise Line Holdings definition); Royal Caribbean reports Net Yields on the same per-berth-day basis
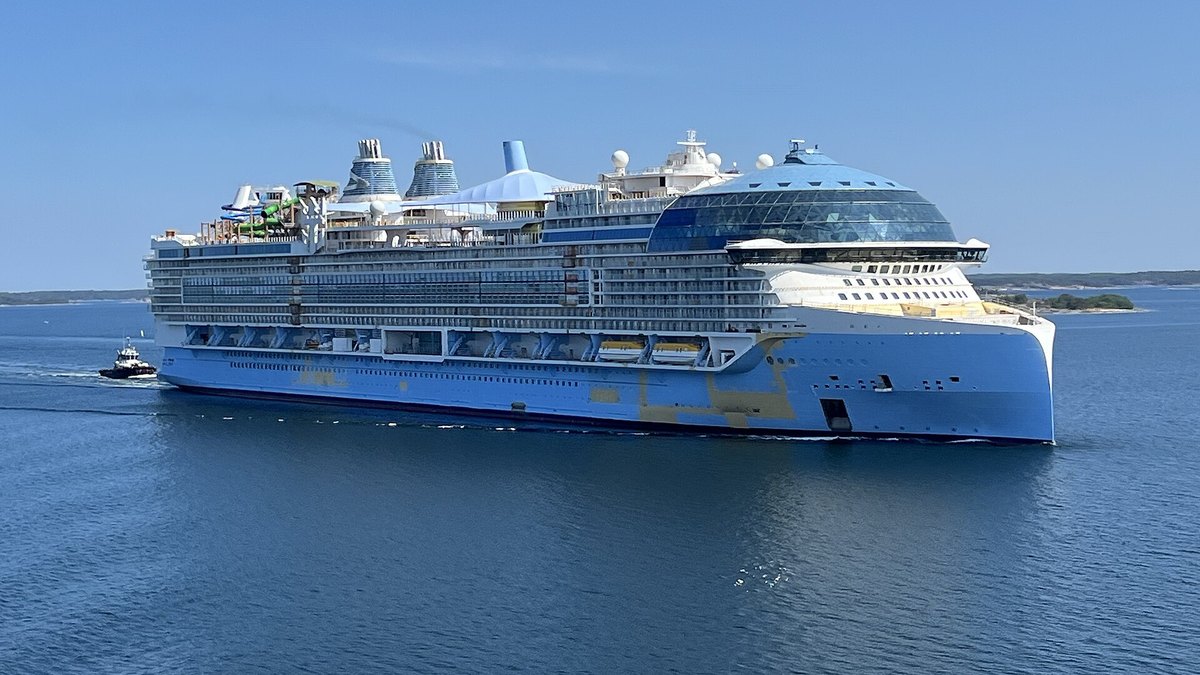
Comparing pricing power across lines of different sizes
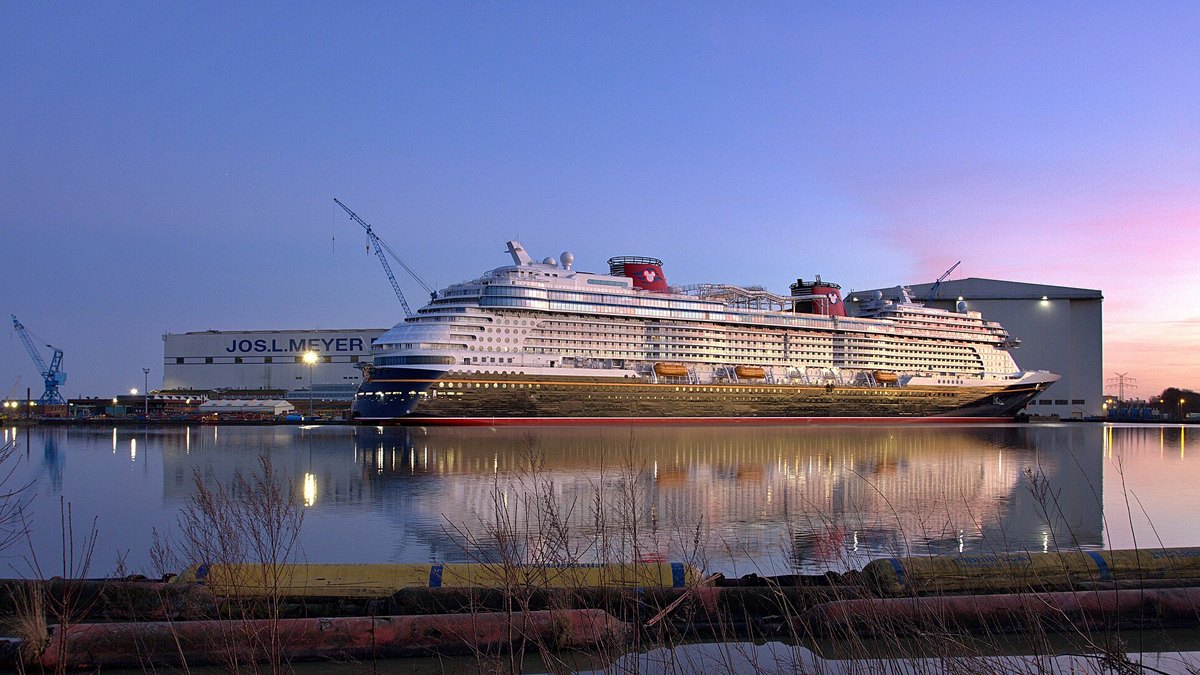
Photo: Chakie2 / CC BY-SA 4.0 via Wikimedia Commons
Answrs VerdictThe headline sales KPI.
Formula: Net Yield is Adjusted Gross Margin per Capacity Day (Norwegian Cruise Line Holdings definition); Royal Caribbean reports Net Yields on the same per-berth-day basisRoyal Caribbean benchmark: Net Yields up 3.8% as-reported (3.7% in Constant Currency) in 2025Carnival benchmark: Net yields (in constant currency) up 2.4% in Q3 fiscal 2026 (quarter ended August 31, 2026), an all-time highNorwegian benchmark: Net Yield up about 2.4% in Constant Currency in 2025, then down 2.6% in Q2 2026 (quarter ended June 30, 2026)
Net Yield is Adjusted Gross Margin per Capacity Day in Norwegian's definition. Royal Caribbean reported Net Yields up 3.8% as-reported in 2025, Carnival reported net yields up 2.4% in constant currency in Q3 fiscal 2026, and Norwegian reported 2.4% for 2025 before a 2.6% decline in Q2 2026.
Go ifComparing pricing power across lines of different sizes
Skip ifYou need cash collected rather than revenue earned per berth day
Why #1 over #2: It combines price and onboard spend per berth day, which occupancy and revenue growth cannot do alone.
2
Cruise Occupancy Rate
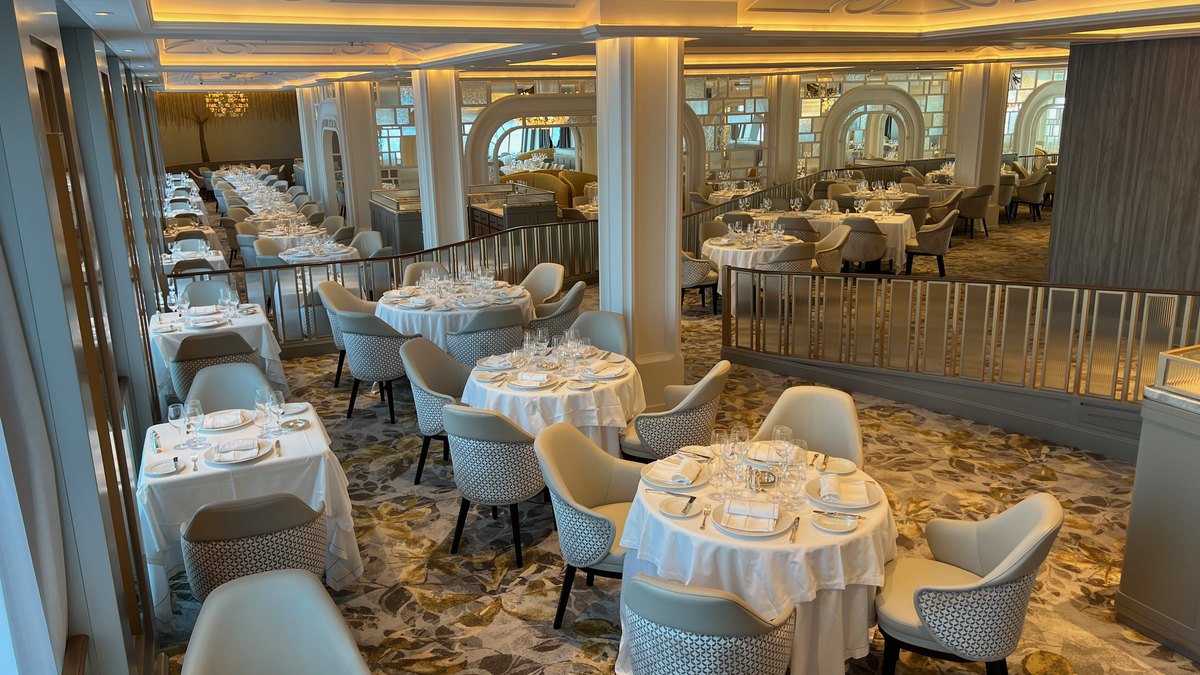
Photo: Thank You (23 Millions+) views from Los Angeles, USA / CC BY 2.0 via Wikimedia Commons
Answrs VerdictThe fill-rate KPI.
Formula: Passenger Cruise Days divided by capacity days; above 100% means three or more guests in some cabinsRoyal Caribbean benchmark: 109.7% in 2025, versus 108.5% in 2024 and 105.6% in 2023Carnival benchmark: 105% in fiscal 2025 and 105% in fiscal 2024, versus 100% in fiscal 2023; Q3 fiscal 2026 was 111.8%, versus 111.7% a year earlierNorwegian benchmark: 103.5% in 2025, versus 104.9% in 2024; about 102.3% guided for full-year 2026
Occupancy is Passenger Cruise Days divided by capacity days. Royal Caribbean reported 109.7% in 2025, Carnival 105% in fiscal 2025 and Norwegian 103.5% in 2025.
Go ifJudging whether ships are full before price is discounted
Skip ifYou only sell charters or single-cabin products
Why #2 over #3: It shows whether ships are full, which Net Yield hides when prices and fill move in opposite directions.
3
Cruise Onboard Revenue Share
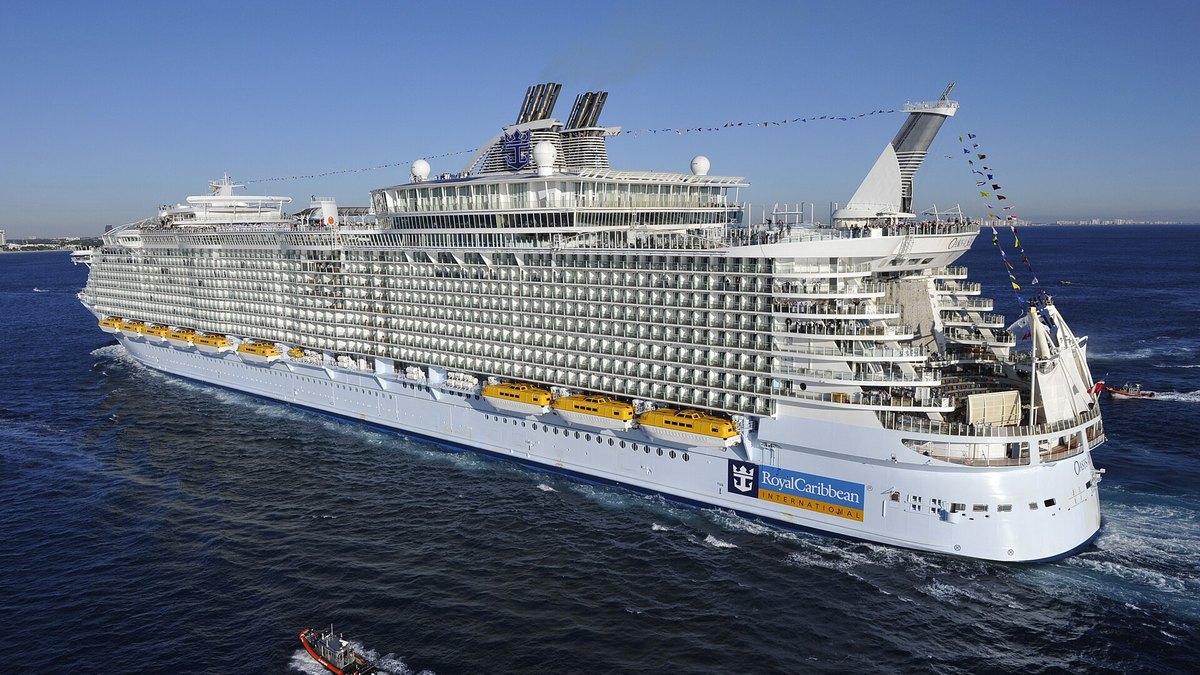
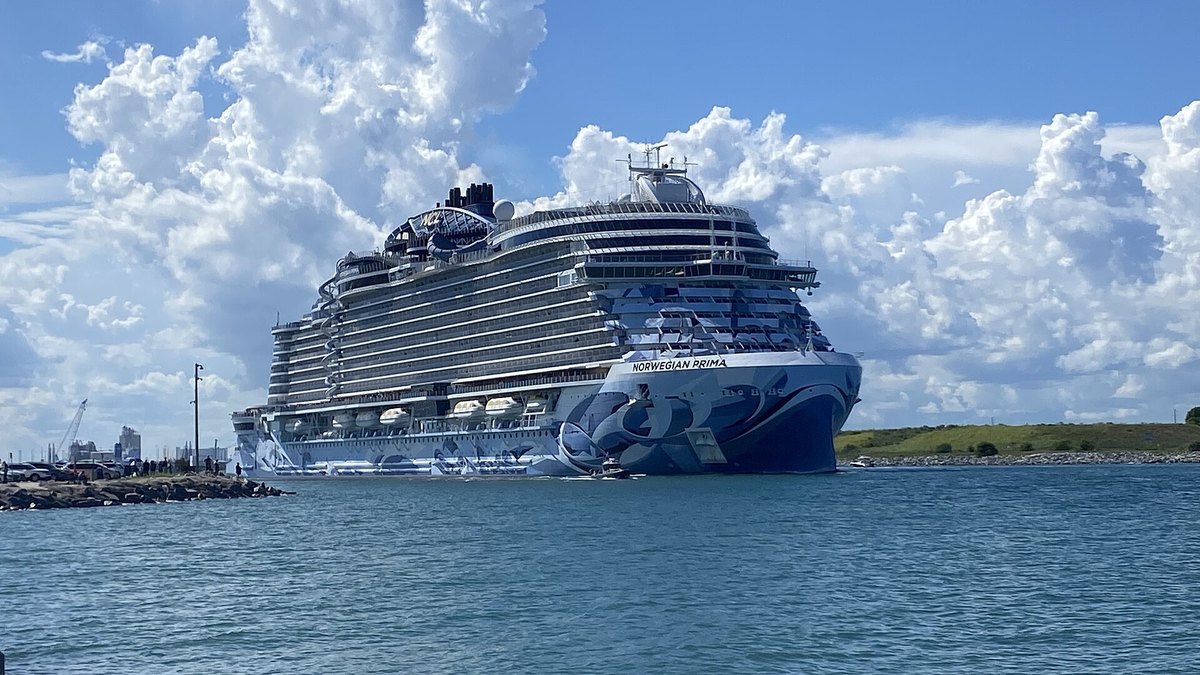
Photo: Captain-tucker / CC BY-SA 3.0 via Wikimedia Commons
Answrs VerdictThe spend-per-guest KPI.
Formula: Onboard and other revenue divided by total revenue; it covers beverages, casino, spa, shore excursions, specialty dining and retailCarnival benchmark: 34% of cruise revenues in 2025; Q3 fiscal 2026 onboard and other revenue was $2,906 million, versus $2,723 million a year earlierRoyal Caribbean benchmark: About 30% of total revenues in 2025, 2024 and 2023Norwegian benchmark: 32.0% of total revenue in 2025, versus 32.3% in 2024
Onboard revenue share is onboard and other revenue as a share of the total. Carnival reported 34% of cruise revenues in 2025, Norwegian 32.0% and Royal Caribbean about 30%.
Go ifSales teams selling packages, excursions and pre-cruise add-ons
Skip ifYou measure only the ticket price and not what guests spend after boarding
Why #3 over #4: It isolates spending after boarding, where passenger volume counts only heads.
4
Cruise Advance Booked Position
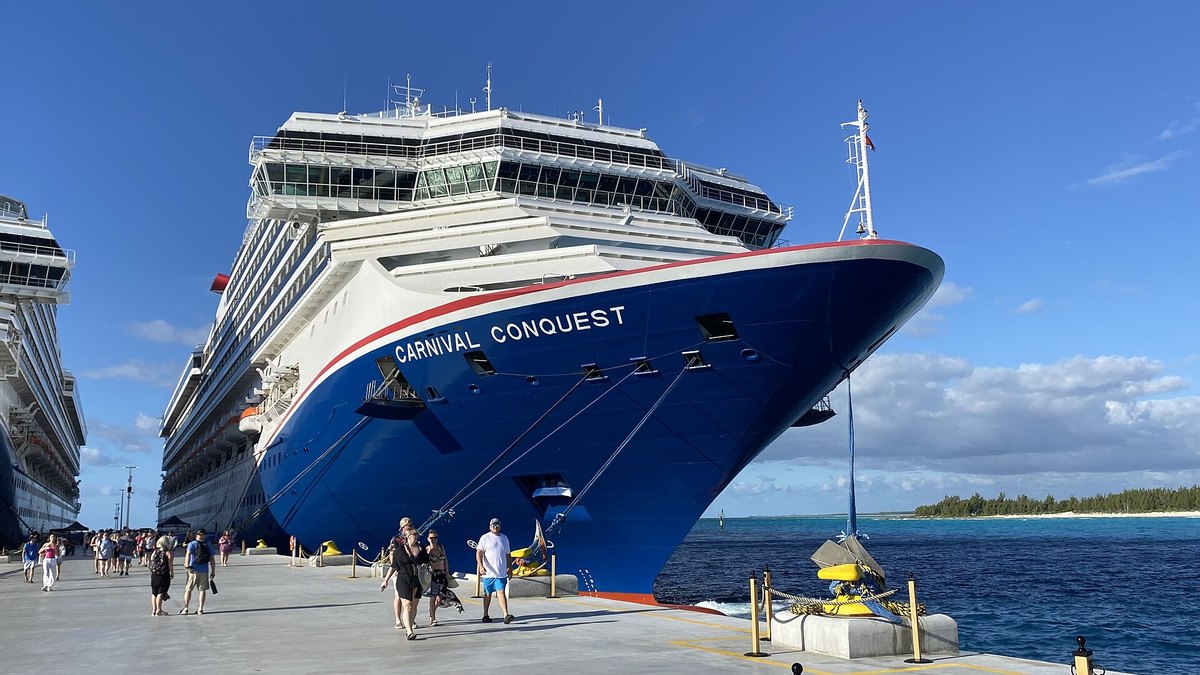
Photo: Richard N Horne / CC BY-SA 4.0 via Wikimedia Commons
Answrs VerdictThe forward-demand KPI.
Definition: How full and at what price future sailings are already soldCarnival: For full-year 2027, booked occupancy and pricing are at record levels (release of September 29, 2026)Royal Caribbean: Booked at record prices with booking volumes above last year, and 2027 booking trends pacing ahead of historical levels (release of July 28, 2026)Norwegian: Remains below its optimal booked position for the next 12 months (release of July 30, 2026); no booked percentage published
Advance booked position shows how much of the coming year is already sold and at what price. Carnival reported 2027 booked occupancy and pricing at record levels, while Norwegian said it remains below its optimal booked position; no percentage is published.
Go ifForecasting next year before the sailings happen
Why #4 over #5: It looks forward, where revenue growth looks back.
5
Cruise Customer Deposits
Photo: RL0919 / CC BY-SA 4.0 via Wikimedia Commons
Answrs VerdictThe cash-in-advance KPI.
Definition: Cash received from guests for future cruises, held as a liability until the voyage is recognized as revenueCarnival benchmark: $6,831 million at November 30, 2025, versus $6,425 million a year earlier; a record $7.6 billion in Q3 fiscal 2026, $0.5 billion above the prior-year recordRoyal Caribbean benchmark: $5,739 million at December 31, 2025, versus $5,496 million a year earlier; $6,736 million at June 30, 2026Norwegian: No customer-deposit benchmark cited here
Customer deposits are cash received for future cruises. Carnival reported $6,831 million at November 30, 2025 and a record $7.6 billion in Q3 fiscal 2026; Royal Caribbean reported $5,739 million at December 31, 2025.
Go ifReading future revenue in dollars, not just in berths
Skip ifYou compare lines without adjusting for size and sailing lengths
Why #5 over #6: It turns booked demand into dollars, which a booked-position statement does not.
6
Cruise Revenue Growth
Photo: Barry Bena / Public domain via Wikimedia Commons
Answrs VerdictThe top-line KPI.
Formula: Year-over-year change in total revenuesCarnival benchmark: Record revenues of $26.6 billion in 2025 ($26,622 million, versus $25,021 million in 2024)Royal Caribbean benchmark: Total revenues of $17,935 million in 2025, versus $16,484 million in 2024; Q2 2026 revenue up 6% to $4.8 billionNorwegian benchmark: Revenue up 3.7% to $9.8 billion in 2025; up 4.9% to $2.6 billion in Q2 2026
Revenue growth is the year-over-year change in total revenues. Carnival reported record revenues of $26.6 billion in 2025, Royal Caribbean $17,935 million and Norwegian $9.8 billion, up 3.7%.
Go ifExecutives checking whether sales growth beats capacity growth
Skip ifYou need price-only growth, which Net Yield isolates
Why #6 over #7: It is the plain top-line check, though capacity growth can flatter it.
7
Cruise Passengers Carried
Photo: Jack Adamenko / CC0 via Wikimedia Commons
Answrs VerdictThe volume KPI.
Formula: Count of guests who sailed in the periodCarnival benchmark: 13.6 million passengers in 2025, versus 13.5 million in 2024Royal Caribbean benchmark: 9,446,010 passengers in 2025, versus 8,564,272 in 2024CLIA industry benchmark: 37.2 million global cruise passengers in 2025; CLIA forecasts 38.3 million in 2026 and 40.3 million in 2027 (CLIA 2026 State of the Cruise Industry report, as reported by Travel Market Report)
Passengers carried counts guests who sailed. Carnival reported 13.6 million in 2025 and Royal Caribbean 9,446,010, while CLIA reported 37.2 million globally and forecasts 40.3 million for 2027.
Go ifSizing volume and market share
Skip ifYou need to know how much each guest paid
Why #7 over #8: It sizes volume, which dollar KPIs cannot show.
8
Cruise Capacity Growth
Photo: Wessel Blokzijl / CC BY-SA 2.0 via Wikimedia Commons
Answrs VerdictThe supply-side KPI.
Definition: Berths available for sale multiplied by cruise days; Royal Caribbean calls it Available Passenger Cruise Days (APCD), Carnival ALBDs, Norwegian Capacity DaysRoyal Caribbean benchmark: 53,325,212 APCD in 2025, versus 50,552,731 in 2024; Q2 2026 capacity up 5%Carnival benchmark: 96.5 million ALBDs in 2025, versus 95.6 million in 2024Norwegian benchmark: 24,433,624 Capacity Days in 2025, versus 23,445,397 in 2024; about 26.25 million guided for 2026
Capacity growth tracks berths available for sale. Royal Caribbean reported 53,325,212 APCD in 2025, Carnival 96.5 million ALBDs and Norwegian 24,433,624 Capacity Days.
Go ifSeparating demand growth from simply adding berths
Skip ifYou judge sales performance from revenue alone
Why #8 over #9: It separates added berths from real demand, which passenger counts blur.
9
Repeat Cruiser Intent
Photo: Joe Ross from Lansing, Michigan / CC BY-SA 2.0 via Wikimedia Commons
Answrs VerdictThe retention KPI.
Definition: Share of past cruisers who say they intend to cruise againCLIA benchmark: Nearly 90% of past cruisers intend to cruise again, the highest level CLIA has recorded; 31% of cruisers were first-time passengersRoyal Caribbean: Lists increasing frequency and repeat booking rates as a strategic goal, with no repeat percentage in the 10-KCarnival: Operates guest loyalty and recognition programs that motivate repeat purchases; no repeat-guest percentage found in the 10-K
Repeat cruiser intent is the share of past cruisers who plan to sail again. CLIA reported nearly 90%, its highest recorded, while the cruise lines publish no repeat percentage in the filings cited.
Go ifLoyalty and past-guest marketing teams
Skip ifYou need actual rebooking rates, which lines do not publish
Why #9 over #10: It measures loyalty directly, which volume KPIs cannot.
10
Cruise Travel Advisor Booking Share
Photo: Jack Adamenko / CC0 via Wikimedia Commons
Answrs VerdictThe channel-mix KPI.
Definition: Share of cruise bookings made through travel advisors rather than directCLIA benchmark: 63% of people who cruised in the last 12 months used a travel advisor, within a 60% to 66% range since 2022Royal Caribbean: Strategy includes maintaining strong relationships with travel advisors while enhancing consumer outreach and e-commerceCarnival: Offers promotions including early booking, past guest recognition and travel agent programs; no share published
Travel advisor booking share shows how much demand arrives through agencies. CLIA research found 63% of recent cruisers used a travel advisor, within a 60% to 66% range since 2022.
Go ifDistribution and trade-sales leaders
Skip ifYou sell only direct and do not use agencies
How we ranked these
We ranked cruise sales KPIs on how directly they show revenue health and how clearly company filings and CLIA define them, using the Carnival, Royal Caribbean and Norwegian Cruise Line Holdings 10-Ks and earnings releases and CLIA data as reported by Travel Market Report and Cruise Hive. We cite a benchmark only where a source states one. Each line defines yields and capacity slightly differently, so cross-company comparisons are approximate. Facts are taken from each maker's own published information; check the official site before you buy.
Questions people ask
What is the most important sales KPI for a cruise line?
Net Yield is the headline sales KPI. Royal Caribbean reported Net Yields up 3.8% as-reported in 2025, and Carnival reported net yields up 2.4% in constant currency in Q3 fiscal 2026.
What is a good cruise occupancy rate?
Royal Caribbean reported 109.7% occupancy in 2025, Carnival 105% in fiscal 2025 and Norwegian 103.5% in 2025. A figure above 100% means three or more guests in some cabins.
How much of cruise revenue comes from onboard spending?
Carnival said 34% of its 2025 cruise revenues came from onboard and other revenue, Norwegian reported 32.0%, and Royal Caribbean reported about 30%.
How many people cruise worldwide?
CLIA reported a record 37.2 million global cruise passengers in 2025 and forecasts 38.3 million in 2026 and 40.3 million in 2027, as reported by Travel Market Report.
Cruise occupancy (load factor), percent at a glance
Carnival 2023100 %
Norwegian 2025103.5 %
Norwegian 2024104.9 %
Carnival 2024105 %
Carnival 2025105 %
Royal Caribbean 2023105.6 %
Royal Caribbean 2024108.5 %
Royal Caribbean 2025109.7 %
Cruise occupancy (load factor), percent, as published by each maker. Picks without a published figure are left off.