Top 10 Sales KPIs in the Agricultural Equipment Dealership Industry in 2027
By Kory White · Updated Oct 2026 · 5 min read
Direct answer
Whole-Goods Unit Sales is the top ag equipment dealership sales KPI in 2027, followed by equipment gross margin and used equipment margin. Titan Machinery reported equipment margin of 7.3%, parts margin of 30.9% and service margin of 61.5% for fiscal 2026. Where no benchmark is published, this page says so.
New tractors and combines sold in the period, tracked against the market; the Association of Equipment Manufacturers (AEM) reports U.S. unit sales monthly
Any dealer that wants to know whether it is gaining or losing share while the whole market shrinks
Equipment gross profit or revenue divided by the number of salespeople
Dealer principals managing sales-team productivity in a shrinking market
Pick by what you want
Best overall
Whole-Goods Unit Sales
Best for profit per sale
Equipment Gross Margin
Best for inventory
Equipment Inventory Turns
Best for the aftermarket
Parts Gross Margin
Best for carrying cost
Floorplan Interest Cost
The ranking
1
Whole-Goods Unit Sales
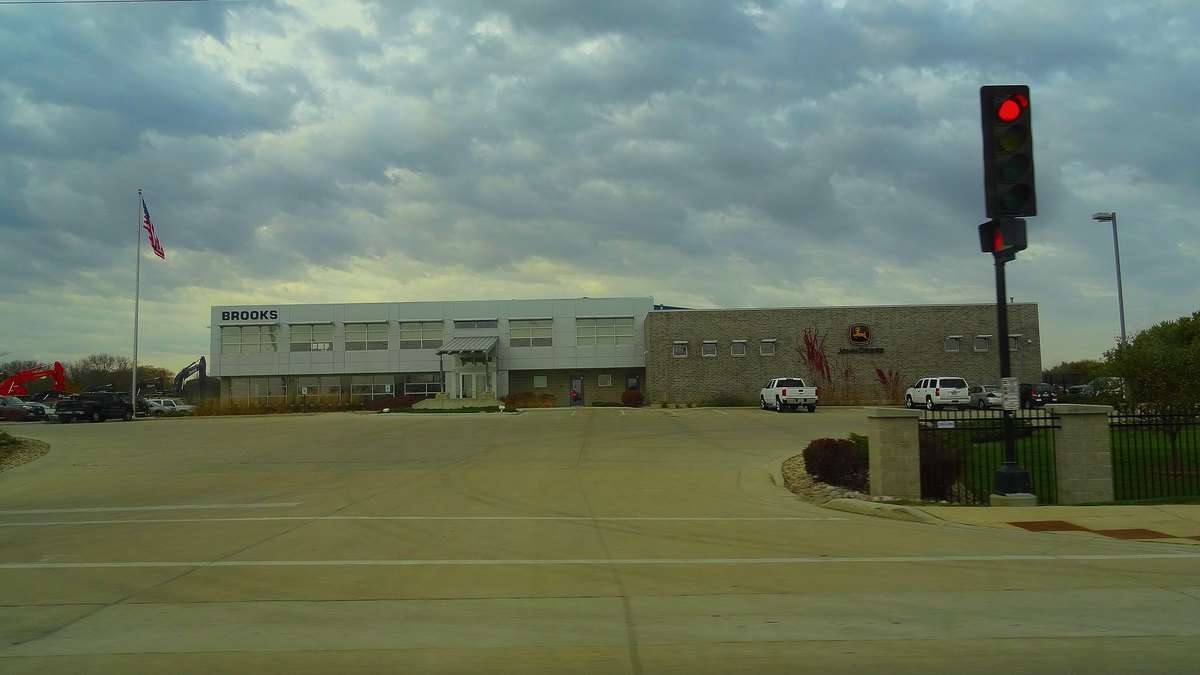
Photo: Bill Harrison / CC BY-SA 2.0 via Wikimedia Commons
Answrs VerdictThe volume KPI.
Definition: New tractors and combines sold in the period, tracked against the market; the Association of Equipment Manufacturers (AEM) reports U.S. unit sales monthlyAEM, December 2025 (U.S.): Total farm tractor sales declined 14.8% from December 2024, and self-propelled combine sales edged down 4.3%AEM, full-year 2025 (U.S.): Farm tractor sales of 195,857 units, nearly 10% below 2024, and combine sales down more than 35% from the prior yearTitan Machinery, fiscal 2026: Equipment revenue of $1,774,535 thousand versus $2,050,298 thousand in fiscal 2025, a decline of 13.4% (year ended January 31, 2026)
Whole-goods unit sales show whether the dealership is selling more or fewer machines than the market. AEM data reported by DAT show U.S. farm tractor sales of 195,857 units for full-year 2025, nearly 10% below 2024, with combines down more than 35%.
Go ifAny dealer that wants to know whether it is gaining or losing share while the whole market shrinks
Skip ifYou need a dealer unit-sales benchmark; Titan reports equipment revenue, not units
Why #1 over #2: It is the volume every other KPI depends on, which is why it ranks first.
2
Equipment Gross Margin
Photo: Mr. Satterly / WTFPL via Wikimedia Commons
Answrs VerdictThe profit-per-sale KPI.
Definition: Equipment revenue minus the cost of that equipment, divided by equipment revenueTitan Machinery, fiscal 2026 (fiscal 2025): 7.3% (6.7%), on gross profit of $129,330 thousand (fiscal 2025: $137,495 thousand)Titan Machinery, fiscal 2027 outlook: Consolidated full-year equipment margin of approximately 8.4%, versus 7.3% in fiscal 2026 (Q4 earnings call, March 19, 2026)Titan Machinery, Q4 fiscal 2026: Company gross margin of 13.5% versus 6.7% in the fourth quarter a year earlier, after inventory impairments lapsed
Equipment gross margin shows what each machine sale earns. Titan Machinery reported 7.3% for fiscal 2026 versus 6.7% a year earlier and expects approximately 8.4% for fiscal 2027.
Go ifDealers deciding whether to discount to clear iron or hold price
Skip ifYou want a private-dealer benchmark; the NAEDA study figures cited here cover service, parts and turns, not equipment margin
Why #2 over #3: It prices each sale, which a unit count cannot.
3
Used Equipment Margin
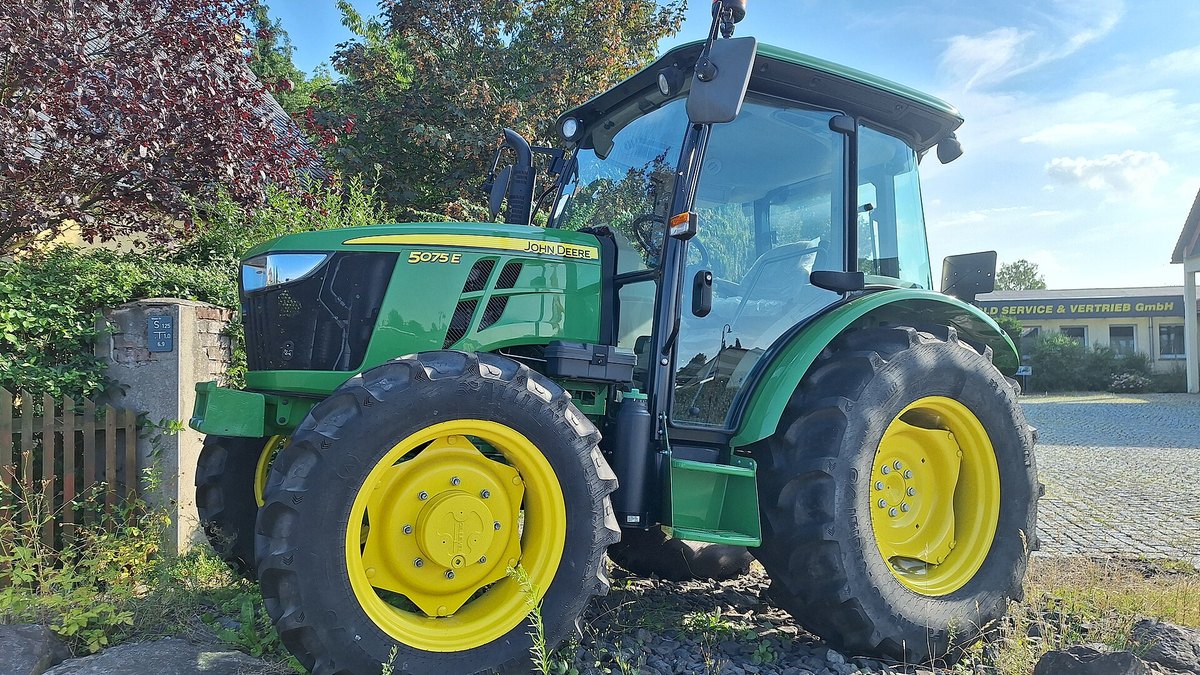
Photo: Michael Rivera / CC BY-SA 4.0 via Wikimedia Commons
Answrs VerdictThe trade-in KPI.
Definition: Gross profit on used machines, which Titan says are primarily acquired through trade-ins from its customersPublished benchmark: None found: Titan’s 10-K reports one equipment margin for new and used together, and no public source cited here gives a used-only marginTitan Machinery, March 2026: CEO Bryan Knutson said additional work remains in certain used equipment (Q4 earnings call)NAEDA, 2024 business year: Used inventory ranged from 9.95% to 25.97% of total assets across the study’s three categories
Used equipment margin tracks the trade-ins that dealers resell. No public source cited here gives a used-only margin, but NAEDA put used inventory at 9.95% to 25.97% of total assets in the 2024 business year.
Go ifDealers that take trade-ins and need to see whether used units earn or lose money
Skip ifYou need an industry margin to compare with; none is published in the sources cited
Why #3 over #4: It governs trade-in discipline, but it has no public benchmark, so it ranks below the published KPIs.
4
Equipment Inventory Turns
Photo: Hugh Venables / CC BY-SA 2.0 via Wikimedia Commons
Answrs VerdictThe inventory-efficiency KPI.
Titan definition: Cost of sales on equipment for the last twelve months divided by the average month-end balances of equipment and parts inventoriesTitan Machinery, fiscal 2026 (fiscal 2025): Equipment inventory turnover of 1.8 times versus 1.6 timesNAEDA, 2024 business year: Inventory turns of 2.52 times for dealers with $200M to $600M volume and 2.82 times for dealers over $600MTitan Machinery, inventory: Total inventories fell $205.6 million to $903.1 million at January 31, 2026
Equipment inventory turns show how fast machines sell through. Titan reported 1.8 times for fiscal 2026 versus 1.6 times, while NAEDA reported 2.52 times for $200M to $600M dealers and 2.82 times for dealers over $600M in the 2024 business year.
Go ifEvery dealer carrying floorplan-financed inventory
Skip ifYou compare Titan to NAEDA directly; the two use different definitions and dealer groups
Why #4 over #5: Turns link sales speed to financing cost, so they rank above the aftermarket KPIs.
5
Aged Equipment Inventory
Photo: Corey Coyle / CC BY 3.0 via Wikimedia Commons
Answrs VerdictThe early-warning KPI.
Titan definition: Equipment held longer than 12 monthsTitan Machinery, second half of fiscal 2026: Aged equipment fell about 45% to $174 million, per CFO Bo LarsenNAEDA, 2024 business year: New inventory was 40.75% of total assets for $200M to $600M dealers and 31.17% for dealers over $600MTitan Machinery, outlook: Equipment margins still faced pressure from remaining aged inventory, and the outlook assumes continued efforts to reduce it
Aged equipment inventory is the stock held longer than 12 months. Titan’s CFO said it fell about 45% to $174 million in the second half of fiscal 2026.
Go ifDealers in a down cycle, where the oldest units do the most margin damage
Skip ifYou need an aged-inventory share benchmark; Titan gives dollars and NAEDA gives share of assets
Why #5 over #6: It flags the units that force discounting, which turns alone do not show.
6
Parts Gross Margin
Photo: Bahnfrend / CC BY-SA 4.0 via Wikimedia Commons
Answrs VerdictThe aftermarket-margin KPI.
Definition: Parts revenue minus cost of parts, divided by parts revenueTitan Machinery, fiscal 2026 (fiscal 2025): 30.9% (31.3%), on parts revenue of $428,261 thousand and gross profit of $132,515 thousandNAEDA, 2024 business year: Parts and accessories gross margin of 30.06% for $200M to $600M dealers and 26.98% for dealers over $600MTitan Machinery, Q4 fiscal 2026: Parts revenue of $91.1 million versus $89.3 million in the fourth quarter a year earlier
Parts gross margin shows the profit on parts sales. Titan reported 30.9% for fiscal 2026 versus 31.3%, and NAEDA reported 30.06% for $200M to $600M dealers and 26.98% for dealers over $600M.
Go ifDealers whose parts counter is the steadier profit pool when machine sales slow
Skip ifYou need parts fill rate or parts sales growth by dealer; no public source cited gives it
Why #6 over #7: It is the most comparable aftermarket figure, since both sources publish it.
7
Service Gross Margin
Photo: Steffen Mokosch / CC BY-SA 4.0 via Wikimedia Commons
Answrs VerdictThe service labor KPI.
Definition: Service revenue minus the cost of service labor and related cost, divided by service revenueTitan Machinery, fiscal 2026 (fiscal 2025): 61.5% (62.9%), on service revenue of $177,910 thousand and gross profit of $109,459 thousandNAEDA, 2024 business year: Service gross margin of 67.38% for $200M to $600M dealers and 52.18% for dealers over $600MPublished benchmark: None found for service labor efficiency or recovery rate; no public source cited publishes one
Service gross margin shows the profit on shop labor. Titan reported 61.5% for fiscal 2026 versus 62.9%, and NAEDA reported 67.38% for $200M to $600M dealers and 52.18% for dealers over $600M.
Go ifDealers measuring whether the shop earns its keep
Skip ifYou need technician efficiency or labor recovery; no public figure exists
Why #7 over #8: It matters for the shop, but labor efficiency and recovery have no public benchmark.
8
Fixed-Cost Absorption
Photo: Michael Trolove / CC BY-SA 2.0 via Wikimedia Commons
Answrs VerdictThe shop-pays-the-rent KPI.
Titan context: Titan says operating at a high absorption rate lets it operate profitably through economic downcyclesTitan Machinery, fiscal 2026 (fiscal 2025): Company-wide absorption rate of 75.2% versus 75.0%NAEDA, 2024 business year: Parts aftermarket absorption of 38.45% for $200M to $600M dealers and 26.68% for dealers over $600MTitan Machinery, March 2026: CEO Bryan Knutson said parts and service generate over half of gross profit dollars
Fixed-cost absorption is the share of overhead covered by gross profit from parts and service. Titan reported a company-wide rate of 75.2% for fiscal 2026 versus 75.0%, and NAEDA reported a parts aftermarket rate of 38.45% for $200M to $600M dealers.
Go ifDealers who want the parts and service departments to cover the building
Skip ifYou compare the Titan and NAEDA rates; they use different definitions
Why #8 over #9: It shows resilience in a downturn, but the two sources define it differently.
9
Floorplan Interest Cost
Photo: The Bushranger / CC BY-SA 4.0 via Wikimedia Commons
Answrs VerdictThe cost-of-carry KPI.
Definition: Interest paid to finance equipment inventory; Titan calls the cost of financing inventory an important factor in its resultsTitan Machinery, fiscal 2026 (fiscal 2025): Floorplan interest expense of $24.1 million versus $34.7 millionTitan Machinery, January 31, 2026: Floorplan payables of $553.8 million versus $755.7 million a year earlierTitan Machinery, why it fell: The 10-K says floorplan interest expense decreased primarily due to lower interest-bearing inventory levels
Floorplan interest cost is the price of carrying inventory. Titan reported floorplan interest expense of $24.1 million for fiscal 2026 versus $34.7 million, with floorplan payables of $553.8 million against $755.7 million.
Go ifDealers whose slow-turning units cost money every month
Skip ifYou need an industry rate; Titan’s figures cover its own financing mix
Why #9 over #10: It is a result of turns and aging, so it ranks below both.
10
Sales per Salesperson
Photo: Joshuarp2002 / CC BY-SA 4.0 via Wikimedia Commons
Answrs VerdictThe team-productivity KPI.
Definition: Equipment gross profit or revenue divided by the number of salespeoplePublished benchmark: None found: the Titan filings and the NAEDA study coverage cited here give no sales-per-salesperson figureRelated, Titan Machinery fiscal 2026: Equipment revenue of $1,774,535 thousand is the total pool the sales team sells fromHow to use it: Set your own baseline from the last twelve months and compare quarter to quarter
Sales per salesperson shows team productivity. No public source cited here publishes an industry figure, so benchmark it against your own last twelve months.
Go ifDealer principals managing sales-team productivity in a shrinking market
Skip ifYou need an external benchmark; none is published in the sources cited
How we ranked these
We ranked KPIs on how directly they drive agricultural equipment sales and profit and how clearly they are defined, using Titan Machinery’s fiscal 2026 Form 10-K and Q4 release filed with the SEC, its March 2026 earnings call as reported by MarketBeat on Yahoo Finance, the NAEDA Cost of Doing Business study as reported by Farm Equipment, and AEM sales data as reported by DAT. Each figure is labeled with whose it is and which period it covers. Where no benchmark is published, the page says so. Facts are taken from each maker's own published information; check the official site before you buy.
Questions people ask
What are the most important sales KPIs for an agricultural equipment dealership?
Unit sales against the market, equipment gross margin, inventory turns and aged inventory show whether sales are profitable. Titan Machinery reported equipment margin of 7.3% and turns of 1.8 times for fiscal 2026.
What is a good equipment gross margin for a farm equipment dealer?
Margins are thin. Titan Machinery reported 7.3% for fiscal 2026 and expects approximately 8.4% for fiscal 2027, compared with 30.9% on parts and 61.5% on service.
What is a normal inventory turn for an equipment dealer?
The NAEDA study reported 2.52 times for $200M to $600M dealers and 2.82 times for dealers over $600M for the 2024 business year. Titan reported 1.8 times for fiscal 2026.
Is there a published benchmark for sales per salesperson or trade-in margin?
Not in the sources cited here. Titan’s 10-K and the NAEDA study coverage give no sales-per-salesperson figure and no used-only margin, so compare against your own prior periods.
Titan Machinery gross margin by revenue line, fiscal 2026 at a glance
Equipment7.3 %
All revenue lines15.8 %
Rental and other24.2 %
Parts30.9 %
Service61.5 %
Titan Machinery gross margin by revenue line, fiscal 2026, as published by each maker. Picks without a published figure are left off.