Top 10 Sales KPIs in the Auto Dealership Industry in 2027
By Kory White · Updated Oct 2026 · 5 min read
Direct answer
New-vehicle gross profit per unit is the top auto dealership sales KPI in 2027, followed by used-vehicle gross profit per unit and F&I per retail unit. For full-year 2025 AutoNation reported $2,564 per new vehicle and Asbury reported $3,432, while NADA put the average franchised dealership at 955 new vehicles sold. Where no benchmark is published, this page says so.
New-vehicle gross profit divided by new vehicles retailed in the period; AutoNation and Group 1 call it gross profit per vehicle retailed or per retail unit
Any store that sells new vehicles: it shows whether each deal still earns a margin after incentives and discounts
Gross profit from parts, service and collision work, shown as dollars, as a share of total gross profit, and as a gross margin on parts and service sales
Every franchised store: fixed operations is the steadiest profit center and funds much of the building’s cost
The average price paid for a new vehicle; Cox Automotive and Kelley Blue Book estimate it monthly, and dealer groups report average selling price per unit
Sales managers and finance managers: price drives the size of each deal, the payment and the F&I opportunity
Total service and parts sales divided by repair orders written, shown for customer-pay and warranty orders
Service managers: it shows how much each customer visit is worth, which feeds the fixed-operations profit above
Pick by what you want
Best overall
New-Vehicle Gross Profit per Unit
Best for used cars
Used-Vehicle Retail Gross Profit per Unit
Best for back-end profit
F&I Gross Profit per Retail Unit
Best for fixed operations
Parts and Service Gross Profit
Best for cost control
SG&A as a Percentage of Gross Profit
The ranking
1
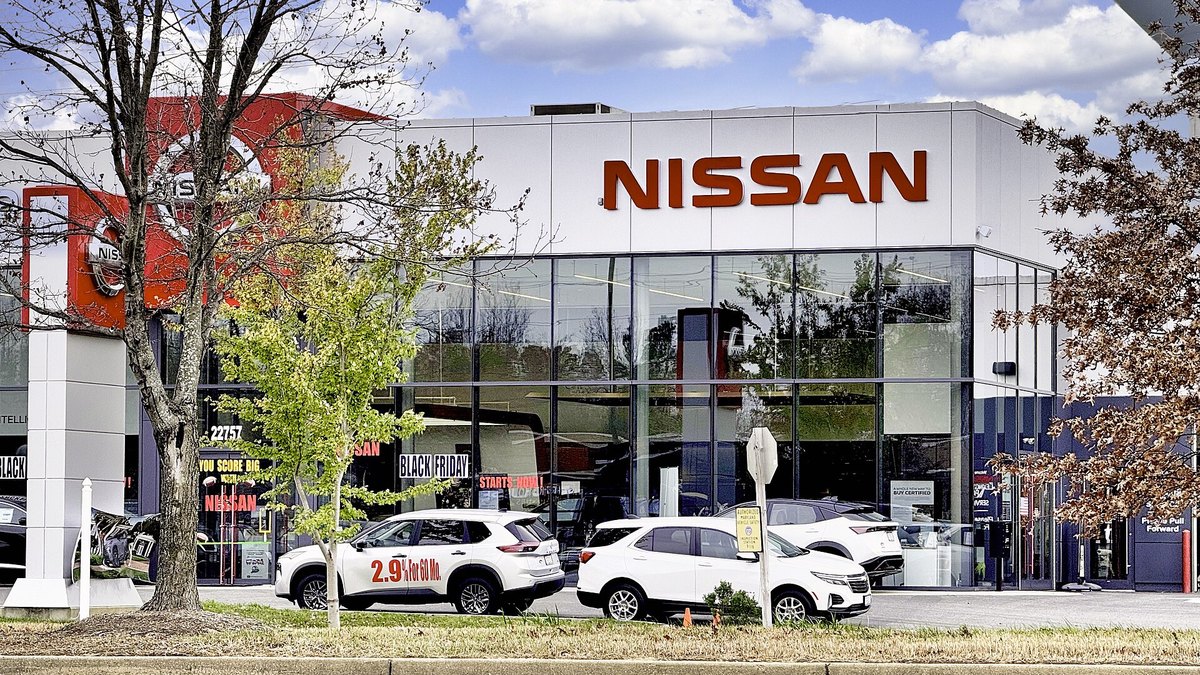
New-Vehicle Gross Profit per Unit
Photo: Harrison Keely / CC BY 4.0 via Wikimedia Commons
Answrs VerdictThe first test of every new-vehicle deal.
Formula: New-vehicle gross profit divided by new vehicles retailed in the period; AutoNation and Group 1 call it gross profit per vehicle retailed or per retail unitAutoNation, full-year 2025: $2,564 per new vehicle retailed, versus $3,045 in 2024; $2,398 in the fourth quarter of 2025Group 1, full-year 2025: $3,370 per new retail unit, down 4.4%; consolidated results include the U.K.Asbury, full-year 2025: $3,432 average gross profit per new vehicle, versus $3,697 in 2024Lithia, full-year 2025: $2,904 per new vehicle, versus $3,164 in 2024Sonic, full-year 2025: $3,165 per retail new vehicle, versus $3,358 in 2024
New-vehicle gross profit per unit shows whether each new-car deal still earns a margin. For full-year 2025 AutoNation reported $2,564, Lithia $2,904, Sonic $3,165, Group 1 $3,370 and Asbury $3,432.
Go ifAny store that sells new vehicles: it shows whether each deal still earns a margin after incentives and discounts
Skip ifYou compare brands directly: luxury-heavy groups such as Asbury report higher figures than volume-brand groups
Why #1 over #2: It is the margin on the largest share of dealership sales, so it ranks first.
2
Used-Vehicle Retail Gross Profit per Unit
Photo: Tdorante10 / CC BY-SA 4.0 via Wikimedia Commons
Answrs VerdictThe used-car margin KPI.
Formula: Used-vehicle retail gross profit divided by used vehicles sold at retail; wholesale units are reported separatelyAutoNation, full-year 2025: $1,555 per used vehicle retail, versus $1,558 in 2024Group 1, full-year 2025: $1,478 per used retail unit, down 6.1%Asbury, full-year 2025: $1,672 average gross profit per used retail vehicle, versus $1,517 in 2024Lithia, full-year 2025: $1,756 per used retail vehicle, versus $1,769 in 2024Sonic, full-year 2025: $1,033 per used vehicle, versus $985 in 2024
Used-vehicle retail gross profit per unit is the margin on cars you buy and sell at retail. For full-year 2025 AutoNation reported $1,555, Group 1 $1,478, Asbury $1,672 and Lithia $1,756.
Go ifUsed-car departments and independents: it is the margin on the cars you buy, recondition and sell at retail
Skip ifYou need an industry-wide average; the public groups report different scopes and Sonic’s figure includes its EchoPark stores
Why #2 over #3: It is smaller per unit than new-vehicle gross, but it measures a sale the store controls from purchase to price.
3
F&I Gross Profit per Retail Unit
Photo: Phillip Pessar / CC BY 2.0 via Wikimedia Commons
Answrs VerdictThe back-end profit KPI.
Formula: Finance and insurance gross profit divided by new and used vehicles retailed in the periodAutoNation, full-year 2025: $2,769 per vehicle retailed, versus $2,612 in 2024Sonic, full-year 2025: $2,695 F&I gross profit per unit, versus $2,450 in 2024Asbury, full-year 2025: $2,214 F&I per vehicle retailed, versus $2,197 in 2024Group 1, full-year 2025: $2,036 F&I gross profit per retail unit, up 1.6%Lithia, full-year 2025: $1,844 finance and insurance gross profit per unit, versus $1,813 in 2024
F&I gross profit per retail unit is the back-end profit on each deal. For full-year 2025 AutoNation reported $2,769, Sonic $2,695, Asbury $2,214 and Group 1 $2,036.
Go ifFinance managers and general managers: it is the profit earned on the back end of each deal, after the vehicle price is set
Skip ifYou are comparing stores with very different lender mixes without checking the reporting basis
Why #3 over #4: It earns more per unit than used-vehicle gross at AutoNation, but it depends on the vehicle sale happening first.
4
Parts and Service Gross Profit
Photo: CZmarlin — Christopher Ziemnowicz, releases all rights but a photo credit would / Public domain via Wikimedia Commons
Answrs VerdictThe steadiest profit center.
Formula: Gross profit from parts, service and collision work, shown as dollars, as a share of total gross profit, and as a gross margin on parts and service salesAutoNation, full-year 2025: Parts and service gross profit of $2,355.1 million, 47.6% of total gross profitGroup 1, full-year 2025: Parts and service gross margin of 55.7%; $394.2 million of gross profit in the fourth quarterAsbury, full-year 2025: Parts and service gross margin of 58.7%, versus 57.4% in 2024Lithia, full-year 2025: Aftersales gross margin of 57.7%, versus 55.9% in 2024Fixed absorption: None found: no source cited here publishes a service-and-parts absorption rate, and NADA’s 2025 summary does not either
Parts and service gross profit is the fixed-operations result. AutoNation’s was $2,355.1 million, 47.6% of its total gross profit, and Asbury reported a 58.7% gross margin. No source cited here publishes service absorption.
Go ifEvery franchised store: fixed operations is the steadiest profit center and funds much of the building’s cost
Skip ifYou need an absorption rate; none is published in the sources cited
Why #4 over #5: It is the steadiest profit center, but it is not a sales KPI in the strict sense, so it ranks behind the three per-unit KPIs.
5
SG&A as a Percentage of Gross Profit
Photo: Billy Hathorn / CC BY-SA 3.0 via Wikimedia Commons
Answrs VerdictThe cost-discipline KPI.
Formula: Selling, general and administrative expenses divided by total gross profit; lower means more of each gross-profit dollar reaches operating profitAutoNation, full-year 2025: 67.9%, versus 68.2% in 2024Lithia, full-year 2025: 68.8% as reported, versus 67.5% in 2024Group 1, full-year 2025: 70.3%, up 304 basis pointsAsbury, fourth quarter 2025: 66.7%; the adjusted figure was 65.3%
SG&A as a percentage of gross profit shows how much gross profit is spent running the store. For full-year 2025 AutoNation reported 67.9%, Lithia 68.8% and Group 1 70.3%.
Go ifGeneral managers and owners: it shows how much of the gross profit the store keeps after paying for people, advertising and the building
Skip ifYou compare quarters with full years, or adjusted figures with reported ones
Why #5 over #6: It measures what the store keeps rather than what it sells, so it ranks below the profit-per-unit KPIs.
6
New-Vehicle Unit Sales Volume
Photo: Harrison Keely / CC BY 4.0 via Wikimedia Commons
Answrs VerdictThe volume KPI.
Formula: New vehicles retailed in the period, reported per store, per group or for the whole franchised channelNADA Data, 2025: The average franchised dealership sold 955 new vehicles, versus 935 in 2024; the 16,990 franchised light-vehicle dealers sold 16.2 million light-duty vehiclesLithia, full-year 2025: 402,575 new vehicle units, versus 406,286 in 2024AutoNation, full-year 2025: 259,264 new retail unitsGroup 1, full-year 2025: 224,166 new vehicles sold, up 10.1%Asbury, full-year 2025: 181,204 new vehicle units, versus 173,218 in 2024
New-vehicle unit sales volume is how many cars the store sells. NADA put the 2025 average at 955 per franchised dealership, while Lithia sold 402,575 and AutoNation 259,264 across their groups.
Go ifSales managers and dealer principals: volume sets how many chances there are to earn gross profit and F&I
Skip ifYou compare groups of different sizes; use per-store averages such as NADA’s instead
Why #6 over #7: Volume sets the number of chances to earn gross profit, but it says nothing about margin.
7
Used-Vehicle Unit Sales and Used-to-New Ratio
Photo: Atwngirl / CC BY-SA 4.0 via Wikimedia Commons
Answrs VerdictThe used-car mix KPI.
Formula: Used vehicles sold at retail, and the ratio of used retail units to new units sold in the same periodAsbury, full-year 2025: Used-to-new ratio of 79.0%, versus 87.0% in 2024; 143,126 used retail units, versus 150,698Lithia, full-year 2025: 425,381 used retail units, versus 411,925 in 2024AutoNation, full-year 2025: 269,558 used retail unitsGroup 1, full-year 2025: 234,906 used retail units, up 12.0%Published ratio: AutoNation, Group 1, Lithia and Sonic do not state a used-to-new ratio in the releases cited
Used-vehicle units and the used-to-new ratio show how much volume comes from used cars. Asbury reported a used-to-new ratio of 79.0% for 2025, and AutoNation sold 269,558 used retail units.
Go ifUsed-car managers and dealer principals tracking how much of the store’s volume comes from used cars
Skip ifYou want an industry ratio; only Asbury states one in the sources cited
Why #7 over #8: Only Asbury states the ratio in the filings cited, which limits its benchmark value.
8
New-Vehicle Days Supply
Photo: dave_7 from Lethbridge, Canada / CC BY 2.0 via Wikimedia Commons
Answrs VerdictThe inventory-pressure KPI.
Formula: New-vehicle inventory in units divided by recent sales pace, expressed in days; groups use slightly different basesNADA Data, 2025: New-vehicle days’ supply of 47 for domestic brands and 41 for imports, with 2,577,974 new units in inventoryAutoNation, December 31, 2025: 45 days of new supply, versus 39 days a year earlier; 38 days of used supplyGroup 1, December 31, 2025: 46 days of new and 36 days of used supply on a consolidated basisAsbury, December 31, 2025: 52 days of new and 38 days of used supplyCox Automotive, January 1, 2026: About 2.77 million new units, a 76-day supply, down from 92 days in early December
New-vehicle days supply shows inventory pressure. NADA reported 47 days for domestic and 41 for imports in 2025, AutoNation 45 days at year end and Cox Automotive a 76-day supply on January 1, 2026.
Go ifInventory and sales managers: it shows when stock is thin enough to hold price or heavy enough to need incentives
Skip ifYou compare across sources without checking the base; Cox, NADA and the groups calculate it differently
Why #8 over #9: It guides pricing and incentives, but the sources calculate it differently, so it ranks below the profit KPIs.
9
Average Transaction Price
Photo: Harrison Keely / CC BY 4.0 via Wikimedia Commons
Answrs VerdictThe deal-size KPI.
Formula: The average price paid for a new vehicle; Cox Automotive and Kelley Blue Book estimate it monthly, and dealer groups report average selling price per unitCox Automotive and Kelley Blue Book, December 2025: New-vehicle average transaction price of $50,326, an all-time high on initial estimates, up 0.8% year over year; average MSRP of $52,627NADA Data, 2025: Average new retail selling price of $48,205, versus $47,652 in 2024Asbury, full-year 2025: Average new-vehicle selling price of $52,406Group 1, full-year 2025: Average new-vehicle retail sales price of $50,990Lithia, full-year 2025: Average new-vehicle selling price of $47,426, excluding agency
Average transaction price sets the size of each deal. Cox Automotive and Kelley Blue Book estimated $50,326 for December 2025, and NADA put the 2025 average new retail selling price at $48,205.
Go ifSales managers and finance managers: price drives the size of each deal, the payment and the F&I opportunity
Skip ifYou treat it as profit; a higher price does not mean a higher gross profit per unit
Why #9 over #10: It describes deal size rather than margin, so a high price does not guarantee a high gross profit.
10
Service Repair Order Value
Photo: G. Edward Johnson / CC BY 4.0 via Wikimedia Commons
Answrs VerdictThe service-visit value KPI.
Formula: Total service and parts sales divided by repair orders written, shown for customer-pay and warranty ordersNADA Data, 2025: $494 of total service and parts sales per customer repair order and $551 per warranty repair orderNADA Data, volume: The average dealership wrote 16,252 repair orders; dealerships together wrote 276,128,228NADA Data, labor: Average customer mechanical labor rate of $186; parts sales of $1.43 per service labor saleGroup benchmark: None found: the group releases cited here do not report a per-repair-order value
Service repair order value shows what each service visit is worth. NADA reported $494 per customer repair order and $551 per warranty repair order for 2025; no public dealer group cited here reports it.
Go ifService managers: it shows how much each customer visit is worth, which feeds the fixed-operations profit above
Skip ifYou need a public-company benchmark; only NADA’s industry average is published in the sources cited
How we ranked these
We ranked KPIs on how directly they drive a dealership’s gross profit and sales and how clearly public filings and NADA define them, using the fourth-quarter and full-year 2025 releases of AutoNation, Group 1, Asbury, Lithia and Sonic, NADA Data’s 2025 financial profile and Cox Automotive’s December 2025 report. Groups report different scopes and periods, so each figure is labeled with whose it is and which period it covers. Where no source publishes a benchmark, the page says so. Facts are taken from each maker's own published information; check the official site before you buy.
Questions people ask
What are the most important sales KPIs for an auto dealership?
Gross profit per new and used vehicle, F&I per retail unit, parts and service gross profit and SG&A as a percentage of gross profit. In 2025 AutoNation reported $2,564 per new vehicle, $1,555 per used retail vehicle and $2,769 of F&I per vehicle retailed.
What is a good new-vehicle gross profit per unit?
Public dealer groups reported between $2,564 (AutoNation) and $3,432 (Asbury) per new vehicle for full-year 2025. Group 1 reported $3,370, Sonic $3,165 and Lithia $2,904.
What is a good SG&A as a percentage of gross profit for a dealership?
For full-year 2025 AutoNation reported 67.9%, Lithia 68.8% as reported and Group 1 70.3%. Lower is better because more gross profit reaches operating profit.
How many days of new-vehicle supply is normal?
NADA put 2025 new-vehicle days’ supply at 47 for domestic brands and 41 for imports. AutoNation reported 45 days at December 31, 2025, and Cox Automotive reported a 76-day supply on January 1, 2026 on a different basis.
New-vehicle gross profit per unit, full-year 2025 at a glance
AutoNation$2,564
Lithia$2,904
Sonic$3,165
Group 1$3,370
Asbury$3,432
New-vehicle gross profit per unit, full-year 2025, as published by each maker. Picks without a published figure are left off.