Top 10 Sales KPIs in the Commercial Agricultural Chemical Distribution Industry in 2027
By Kory White · Updated Nov 2026 · 5 min read
Direct answer
Crop protection sales growth is the top sales KPI for a commercial agricultural chemical distributor in 2027, followed by gross margin dollars and the proprietary share of that margin. Nutrien's Retail segment reported crop protection products sales of $6,105 million in 2025 with gross margin of $1,590 million, and proprietary products were 32% of that margin. USDA NASS put U.S. farm spending on agricultural chemicals at $21,300 million in 2025. Where no figure is published, this page says so.
Year-over-year change in crop protection product sales; Nutrien reports it for its Retail segment, which distributes crop nutrients, crop protection products, seed and merchandise to farmers
Distributors checking whether chemical volume and pricing are keeping pace with the season
Retail selling, general and administrative and other expenses, excluding depreciation and amortization, divided by Retail gross margin excluding depreciation and amortization, for the last four rolling quarters
Distributors checking whether selling and branch costs are eating the gross margin earned on chemicals
Retail average working capital divided by Retail sales for the last four rolling quarters; Nutrien says a lower or higher percentage represents increased or decreased efficiency, respectively
Distributors measuring how much cash the prepay, inventory and credit cycle ties up
Receivables aged more than 90 days past due and the bad debt expense on them; Nutrien Financial extends payment terms, typically up to one year, so growers can align payment with crop cycles
Distributors extending season-long credit to growers who pay after harvest
The split of a crop protection maker's sales change into price, volume and currency; Corteva is a manufacturer, not a distributor, and sells through distributors and retailers
Distributors forecasting the cost of goods they will buy and the pricing pressure on shelf prices
The dollar value of crop protection product held by distributors and retailers and the price and rebate terms attached to it; FMC is a manufacturer, not a distributor
Distributors deciding how much chemical to carry into the season and how to read rebate programs
USDA NASS defines agricultural chemicals as an expense line that includes material and application costs, measured across U.S. farms
Distributors sizing the total chemical spend their customers make each year
Pick by what you want
Best overall
Ag Chemical Distributor Crop Protection Sales Growth
Best for profit mix
Ag Chemical Distributor Proprietary Products Share of Crop Protection Margin
Best for cost control
Ag Chemical Distributor Cash Operating Coverage Ratio
Best for credit risk
Ag Chemical Distributor Customer Credit Quality and Bad Debt
Best for stocking risk
Ag Chemical Channel Inventory Value and Rebates
The ranking
1
Ag Chemical Distributor Crop Protection Sales Growth
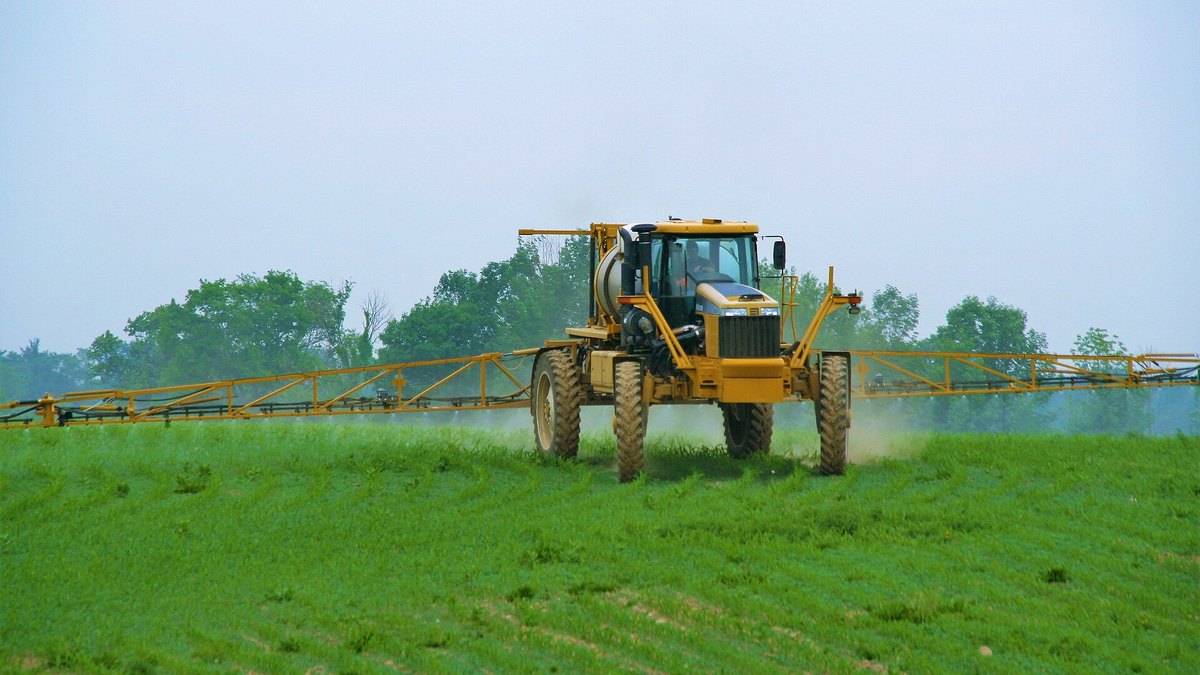
Photo: Pl77 / CC BY-SA 3.0 via Wikimedia Commons
Answrs VerdictThe headline sales KPI.
Definition: Year-over-year change in crop protection product sales; Nutrien reports it for its Retail segment, which distributes crop nutrients, crop protection products, seed and merchandise to farmersNutrien Retail, 2025: Crop protection products sales of $6,105 million versus $6,313 million in 2024, lower on product mix shifts in North America and dry conditions in AustraliaNutrien Retail, Q2 2026: Crop protection products sales of $2,755 million versus $2,666 million in the second quarter of 2025, higher on proprietary products and increased herbicide volumes in the USNutrien Retail, six months 2026: Crop protection products sales of $3,892 million versus $3,638 million for the six months ended June 30, 2025
Crop protection sales growth is the change in chemical revenue from the prior year. Nutrien's Retail segment reported $6,105 million in 2025 versus $6,313 million, then $2,755 million in the second quarter of 2026 versus $2,666 million, helped by proprietary products and more herbicide volume in the US.
Go ifDistributors checking whether chemical volume and pricing are keeping pace with the season
Skip ifYou need a benchmark across many distributors; Nutrien is the only large ag retailer found that reports crop protection sales
Why #1 over #2: It shows whether chemicals are actually moving to growers, which margin alone cannot.
2
Ag Chemical Distributor Crop Protection Gross Margin Dollars
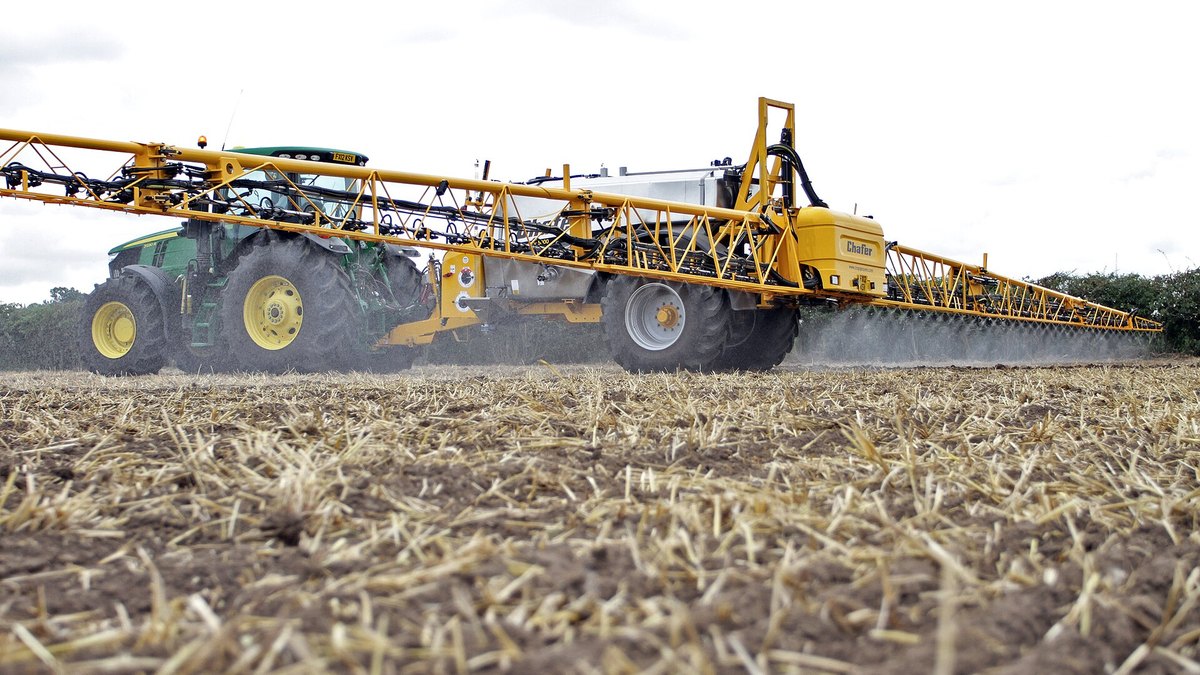
Photo: Chafer Machinery / CC BY 2.0 via Wikimedia Commons
Answrs VerdictThe profit-dollar KPI.
Definition: Crop protection sales minus cost of goods sold, as Nutrien reports gross margin for its Retail crop protection lineNutrien Retail, 2025: Crop protection products gross margin of $1,590 million versus $1,622 million in 2024Nutrien Retail, Q2 2026: Crop protection products gross margin of $707 million versus $676 million in the second quarter of 2025Nutrien Retail, six months 2026: Crop protection products gross margin of $933 million versus $867 million for the six months ended June 30, 2025
Gross margin dollars show what the chemical line earns after cost of goods. Nutrien Retail crop protection gross margin was $1,590 million in 2025 versus $1,622 million, and $707 million in the second quarter of 2026 versus $676 million.
Go ifDistributors judging whether growth in chemical sales is turning into gross profit
Skip ifYou want a margin percentage; Nutrien publishes margin dollars by product line, not a percentage
Why #2 over #3: It shows profit on the sales, where mix share shows where the profit comes from.
3
Ag Chemical Distributor Proprietary Products Share of Crop Protection Margin
Photo: bdk / CC BY-SA 3.0 via Wikimedia Commons
Answrs VerdictThe mix-quality KPI.
Definition: Nutrien reports proprietary product gross margin as a percentage of the total gross margin of the product lineNutrien Retail, 2025: Proprietary crop protection gross margin of $503 million versus $470 million, or 32% of the product line versus 29% in 2024Nutrien Retail, Q2 2026: Proprietary crop protection gross margin of $314 million versus $246 million, or 45% of the product line versus 37%Nutrien Retail, all product lines, 2025: Proprietary products gross margin of $1,104 million versus $1,060 million, or 24% of Retail product margin versus 23%
The proprietary share is own-brand margin as a percentage of the product line margin. Nutrien reported 32% for crop protection in 2025 versus 29%, and 45% in the second quarter of 2026 versus 37%. No other distributor publishes this share.
Go ifDistributors deciding how much shelf and sales effort to put behind own-brand chemistry
Skip ifYou carry only third-party brands; no other distributor publishes this share
Why #3 over #4: It explains margin quality, which total adjusted EBITDA hides.
4
Ag Chemical Distributor Adjusted EBITDA Margin
Photo: Rick Obst / CC BY 4.0 via Wikimedia Commons
Answrs VerdictThe bottom-line KPI.
Definition: Retail adjusted EBITDA divided by Retail sales for the last four rolling quarters, a supplementary measure Nutrien reportsNutrien Retail, 2025: Retail adjusted EBITDA margin of 9.9% versus 9.5% in 2024, on adjusted EBITDA of $1,736 million versus $1,696 million and sales of $17,620 million versus $17,832 millionNutrien Retail, Q2 2026: Adjusted EBITDA of $1,131 million versus $1,149 million in the second quarter of 2025, down 2% on lower crop nutrient volumes and higher fuel costsNutrien 2026 guidance: Retail adjusted EBITDA guidance of $1.75 to $1.95 billion
Adjusted EBITDA margin shows profit after operating costs across all inputs. Nutrien Retail reported 9.9% in 2025 versus 9.5%, on adjusted EBITDA of $1,736 million, and guides to $1.75 to $1.95 billion for 2026.
Go ifOwners comparing overall profitability after operating costs, across all inputs sold
Skip ifYou need a crop-protection-only margin; Nutrien does not publish EBITDA by product line
Why #4 over #5: It is the full-business result, where coverage ratio isolates the cost side.
5
Ag Chemical Distributor Cash Operating Coverage Ratio
Photo: Visitor7 / CC BY-SA 3.0 via Wikimedia Commons
Answrs VerdictThe cost-to-serve KPI.
Definition: Retail selling, general and administrative and other expenses, excluding depreciation and amortization, divided by Retail gross margin excluding depreciation and amortization, for the last four rolling quartersNutrien Retail, 2025: Cash operating coverage ratio of 62% versus 63% in 2024Nutrien Retail, rolling four quarters to June 30, 2026: Cash operating coverage ratio of 63%, on operating expenses excluding depreciation of $2,988 million against gross margin excluding depreciation of $4,766 millionHow to read it: Nutrien says it uses the measure to assess the underlying economics and operating performance of Retail; a lower ratio means less of each gross margin dollar goes to operating costs
Cash operating coverage is operating expenses divided by gross margin, both before depreciation. Nutrien Retail reported 62% in 2025 versus 63%, and 63% for the four quarters to June 30, 2026.
Go ifDistributors checking whether selling and branch costs are eating the gross margin earned on chemicals
Skip ifYou are a small independent; no benchmark for independents is published
Why #5 over #6: It shows cost to serve, which working capital to sales does not.
6
Ag Chemical Distributor Working Capital to Sales
Photo: Ammodramus / CC0 via Wikimedia Commons
Answrs VerdictThe cash-efficiency KPI.
Definition: Retail average working capital divided by Retail sales for the last four rolling quarters; Nutrien says a lower or higher percentage represents increased or decreased efficiency, respectivelyNutrien Retail, 2025: Average working capital to sales of 22% versus 20% in 2024Nutrien Retail, rolling four quarters to June 30, 2026: Average working capital to sales of 23%, on average working capital of $4,319 million and sales of $18,481 millionSeasonality: Nutrien said Retail inventories decrease and receivables increase with the seasonality of its Retail segment, with prepaid inventories delivered in the spring
Working capital to sales shows how much cash the season ties up. Nutrien Retail reported 22% in 2025 versus 20%, and 23% for the four quarters to June 30, 2026, on average working capital of $4,319 million.
Go ifDistributors measuring how much cash the prepay, inventory and credit cycle ties up
Skip ifYou want a figure for crop protection alone; it is reported for the whole Retail segment
Why #6 over #7: It measures cash tied up, where credit quality measures what may not come back.
7
Ag Chemical Distributor Customer Credit Quality and Bad Debt
Photo: Bob Adams from Amanzimtoti, South Africa / CC BY-SA 2.0 via Wikimedia Commons
Answrs VerdictThe credit-risk KPI.
Definition: Receivables aged more than 90 days past due and the bad debt expense on them; Nutrien Financial extends payment terms, typically up to one year, so growers can align payment with crop cyclesNutrien Retail, December 31, 2025: Gross receivables of $3,163 million with $212 million more than 90 days past due; bad debt expense of $46 million in 2025 versus $55 million in 2024Nutrien Retail, June 30, 2026: Gross receivables of $5,174 million with $262 million more than 90 days past due; bad debt expense of $32 million in the six months ended June 30, 2026Nutrien Financial, 2025: Adjusted net interest margin of 5.4% versus 5.3% in 2024
Credit quality tracks past-due receivables and bad debt. Nutrien had $212 million more than 90 days past due on $3,163 million of gross receivables at December 31, 2025, and $262 million on $5,174 million at June 30, 2026. Bad debt was $46 million in 2025 versus $55 million.
Go ifDistributors extending season-long credit to growers who pay after harvest
Skip ifYou sell cash-on-delivery; credit KPIs matter less
Why #7 over #8: It measures collection risk, where price and volume measure supplier pressure.
8
Crop Protection Manufacturer Price and Volume Change (Distributor Supply Side)
Photo: Gons / CC BY-SA 4.0 via Wikimedia Commons
Answrs VerdictThe supplier-pricing KPI.
Definition: The split of a crop protection maker's sales change into price, volume and currency; Corteva is a manufacturer, not a distributor, and sells through distributors and retailersCorteva Crop Protection, Q2 2026: Net sales of $1,847 million versus $1,919 million, a 4% price decline and a 2% volume decrease, partly offset by a 2% currency gain; North America net sales of $593 million versus $675 millionCorteva Crop Protection, first half 2026: Net sales of $3,729 million versus $3,629 million, with volume up 2% and price down 3%Corteva, cause: Corteva attributed the Q2 volume decrease primarily to channel purchase timing in North America and the price decline primarily to the competitive pricing environment in Latin America
Supplier price and volume shows the pressure on what distributors buy and sell. Corteva, a manufacturer, reported second-quarter 2026 Crop Protection sales of $1,847 million, down 4% on a 4% price decline and 2% volume decrease, and first-half sales of $3,729 million with volume up 2% and price down 3%.
Go ifDistributors forecasting the cost of goods they will buy and the pricing pressure on shelf prices
Skip ifYou need a distributor sell-through figure; a maker's sales are shipments into the channel
Why #8 over #9: It looks upstream, where channel inventory looks at stock already on distributor shelves.
9
Ag Chemical Channel Inventory Value and Rebates
Photo: IveGoneAway / CC BY-SA 4.0 via Wikimedia Commons
Answrs VerdictThe stocking-risk KPI.
Definition: The dollar value of crop protection product held by distributors and retailers and the price and rebate terms attached to it; FMC is a manufacturer, not a distributorFMC, Q3 2026: Revenue of $106 million versus $542 million in the prior-year quarter, including a $639 million negative impact from commercial actions announced October 15, 2026 to modify its North America pricing and rebate model and address higher-priced products held by channel customersFMC, channel behavior: FMC said channel customers want to operate with very low inventory values because of high financing costs, the perception of ample supply and demand uncertainty; revenue excluding India and the actions was $745 million, down 22%, with volume down 21%FMC, inventory adjustment: About $175 million of the impact reflects pricing adjustments on high-priced products held by channel customers in Brazil, the United States, Canada and ArgentinaCorteva outlook: Corteva said Crop Protection benefits from normalized channel inventories (July 2026)
Channel inventory is product held downstream of the maker. FMC, a manufacturer, took a $639 million revenue impact in the third quarter of 2026 from pricing and rebate actions, said channel customers want very low inventory values, and cited about $175 million of pricing adjustments on product held by customers in Brazil, the United States, Canada and Argentina.
Go ifDistributors deciding how much chemical to carry into the season and how to read rebate programs
Skip ifYou want a distributor days-on-hand number; Not published by any company read
Why #9 over #10: It measures stocking risk, where USDA spending measures the size of demand.
10
Grower Spending on Agricultural Chemicals (Demand Base)
Photo: Blervis / CC0 via Wikimedia Commons
Answrs VerdictThe market-size KPI.
Definition: USDA NASS defines agricultural chemicals as an expense line that includes material and application costs, measured across U.S. farmsUSDA NASS, 2025: U.S. farms spent $21,300 million on agricultural chemicals in 2025, 4.3% of total farm expenditures, versus $21,700 million, or 4.5%, in 2024USDA NASS, 2021-2023: $17,800 million in 2021, $21,400 million in 2022 and $21,600 million in 2023CHS, fiscal 2026: CHS said Agronomy volumes decreased on deferred purchasing decisions by U.S. farmers and margins on agronomy products were lower on strong competition; Agronomy pretax earnings were $354.6 million versus $375.3 million
Grower chemical spend sizes the market. USDA NASS reported $21,300 million in 2025, 4.3% of farm expenditures, versus $21,700 million in 2024 and $17,800 million in 2021. CHS said lower agronomy volumes reflected deferred purchasing decisions by U.S. farmers.
Go ifDistributors sizing the total chemical spend their customers make each year
Skip ifYou need spending on crop protection products alone; the USDA line includes application costs
How we ranked these
We ranked ten sales KPIs for commercial agricultural chemical distributors by how directly each measures distributor sales and whether a public source states a figure for it. Distributor data comes from Nutrien's Retail segment: its 2025 annual report (annual report filed in 2026) and its second-quarter 2026 report of August 5, 2026. Nutrien Retail sells crop nutrients, crop protection, seed and merchandise, so segment figures cover more than chemicals unless a crop protection line is named. CHS is a farmer-owned cooperative whose fiscal 2026 results (year ended August 31, 2026) were released on November 4, 2026. Manufacturer data comes from Corteva (second quarter 2026) and FMC (third quarter 2026); a manufacturer's figure measures shipments into the channel, not distributor sales. Grower spending comes from the USDA NASS Farm Production Expenditures 2025 Summary of July 2026. Private distributors do not publish results, so no independent-retailer benchmark exists in the pages read. Where no number is published we say so instead of estimating. Facts are taken from each maker's own published information; check the official site before you buy.
Questions people ask
How much crop protection does a large ag retailer sell?
Nutrien's Retail segment reported crop protection products sales of $6,105 million in 2025 with gross margin of $1,590 million.
What share of crop protection margin comes from proprietary products?
Nutrien reported proprietary products at 32% of its Retail crop protection gross margin in 2025, and 45% in the second quarter of 2026.
How much do U.S. farmers spend on agricultural chemicals?
USDA NASS reported $21,300 million in 2025, 4.3% of total farm expenditures, including material and application costs.
What is channel inventory in crop protection?
It is product held by distributors and retailers. FMC, a manufacturer, said in October 2026 that channel customers were operating with very low inventory values and took a $639 million revenue impact from pricing and rebate actions.
U.S. farm spending on agricultural chemicals, USDA NASS, million dollars at a glance
U.S. farm spending on agricultural chemicals, 202117,800 $ million
U.S. farm spending on agricultural chemicals, 202521,300 $ million
U.S. farm spending on agricultural chemicals, 202221,400 $ million
U.S. farm spending on agricultural chemicals, 202321,600 $ million
U.S. farm spending on agricultural chemicals, 202421,700 $ million
U.S. farm spending on agricultural chemicals, USDA NASS, million dollars, as published by each maker. Picks without a published figure are left off.