answrsnow
Industry Benchmarks · Top 10

Top 10 Sales KPIs in the Commercial Material Handling Equipment Dealership Industry in 2027
By Kory White · Updated Nov 2026 · 5 min read
Material Handling Dealer New and Used Equipment Sales Growth
Direct answer

New and used equipment sales growth is the top sales KPI for a commercial material handling equipment dealership in 2027, followed by lift truck bookings and backlog. Alta Equipment Group reported Material Handling organic new and used equipment sales down 7.7% in 2025, with segment gross profit of 33.0% and service gross margin of 59.1%. Hyster-Yale, a manufacturer, reported backlog of approximately $1,580 million at June 30, 2026. Where no figure is published, this page says so.

At a glance

#PickDefinitionBest for
1Material Handling Dealer New and Used Equipment Sales GrowthYear-over-year change in revenue from new and used equipment; Alta Equipment Group reports it as organic new and used equipment sales in its Material Handling segmentDealers checking whether equipment deliveries are keeping pace with the lift truck market
2Material Handling Dealer Lift Truck Bookings (Order Intake)Hyster-Yale reports lift truck unit bookings as an approximate sales value, calculated from current unit bookings and the forecasted average sales price per unitDealers forecasting deliveries two to three quarters ahead
3Material Handling Dealer Lift Truck BacklogHyster-Yale calculates the dollar value of backlog from current unit backlog and the forecasted average sales price per unit; substantially all of it is expected to be sold within twelve monthsDealers deciding how many deliveries are already committed for the next two quarters
4North American Lift Truck Orders and Shipments (WITS)The World Industrial Truck Statistics program tracks orders and shipments of industrial trucks; the Industrial Truck Association reports North AmericaDealers comparing their own unit orders and deliveries with the whole regional market
5Material Handling Dealer Segment Gross MarginGross margin ratio is (revenue minus cost of goods sold) divided by revenueOwners judging whether the mix of equipment, parts, service and rental is paying
6Material Handling Dealer New and Used Lift Truck Gross MarginGross profit as a percentage of new and used equipment sales revenue, reported by Alta for its Material Handling segmentDealers pricing trucks and checking whether discounting or tariffs are eroding the sale
7Material Handling Dealer Parts Sales and Parts Gross MarginAlta sells replacement parts to customers and supplies parts to its own rental fleet; the majority of its parts inventory is OEM replacement partsDealers measuring how much of each truck in the field turns into parts revenue
8Material Handling Dealer Service Revenue, Service Margin and Technician UtilizationAlta's systems track labor utilization statisticsDealers deciding whether to add technicians or raise labor rates
9Material Handling Dealer Rental Revenue and Rental Fleet UtilizationAlta rents equipment on a daily, weekly and monthly basis; its rental fleet original acquisition cost was $529.8 million at December 31, 2025Dealers deciding how big a rental fleet to hold against rent-to-sell demand
10Material Handling Dealer Equipment Inventory Turnover (Inventories-to-Sales)Inventory turnover ratio is cost of goods sold divided by average inventory; the Census inventories/sales ratio is the dollar value of inventories divided by the dollar value of salesDealers deciding how many new and used trucks to hold on the lot

Pick by what you want

Best overall
Material Handling Dealer New and Used Equipment Sales Growth
Best leading indicator
Material Handling Dealer Lift Truck Bookings (Order Intake)
Best for profit mix
Material Handling Dealer Segment Gross Margin
Best for aftermarket
Material Handling Dealer Service Revenue, Service Margin and Technician Utilization
Best for rental
Material Handling Dealer Rental Revenue and Rental Fleet Utilization

The ranking

1

Material Handling Dealer New and Used Equipment Sales Growth

Material Handling Dealer New and Used Equipment Sales Growth
Photo: Huangdan2060 / CC BY 3.0 via Wikimedia Commons
Answrs VerdictThe headline sales KPI.
Definition: Year-over-year change in revenue from new and used equipment; Alta Equipment Group reports it as organic new and used equipment sales in its Material Handling segmentAlta, 2025: Organic new and used equipment sales in Material Handling decreased 7.7%, to $333.3 million from $361.3 million, as customers deferred capital spending and extended replacement cyclesAlta, Q2 2026: Organic sales of new and used equipment decreased 5.0% year over year in the quarter and 4.2% in the six months ended June 30, 2026Outlook: Alta said backlog levels remained healthy and bookings momentum improved, supporting expectations for stronger invoicing in the second half of 2026

Equipment sales growth is the change in new and used equipment revenue from the prior year. Alta Equipment Group reported organic new and used equipment sales in Material Handling down 7.7% to $333.3 million in 2025, then down 5.0% in the second quarter of 2026 and 4.2% over six months, while saying backlog levels remained healthy.

Go ifDealers checking whether equipment deliveries are keeping pace with the lift truck market
Skip ifYou need a benchmark across many dealers; Alta is the only public lift truck dealer figure found
Why #1 over #2: It shows whether trucks are being delivered, which margin alone cannot.
2

Material Handling Dealer Lift Truck Bookings (Order Intake)

Material Handling Dealer Lift Truck Bookings (Order Intake)
Photo: Norbert Schnitzler / CC BY-SA 3.0 via Wikimedia Commons
Answrs VerdictThe leading-indicator KPI.
Definition: Hyster-Yale reports lift truck unit bookings as an approximate sales value, calculated from current unit bookings and the forecasted average sales price per unitHyster-Yale, Q2 2026: Bookings of approximately $680 million in the second quarter of 2026 versus $330 million in 2025, and $1,260 million for six months versus $920 million (manufacturer, not a dealer)Trend: Hyster-Yale said bookings increased 17% from the first quarter and more than doubled from the prior year, the strongest booking quarter in three yearsDealer view: Alta Equipment Group said bookings momentum improved in the quarter ended June 30, 2026

Bookings measure new orders. Hyster-Yale, a manufacturer, reported bookings of approximately $680 million in the second quarter of 2026 versus $330 million, up 17% from the first quarter, the strongest booking quarter in three years. Alta said bookings momentum improved in the same quarter.

Go ifDealers forecasting deliveries two to three quarters ahead
Skip ifYou need dealer-level order intake; Alta gives no dollar figure for bookings
Why #2 over #3: It looks forward at deliveries, where sales growth looks back.
3

Material Handling Dealer Lift Truck Backlog
Material Handling Dealer Lift Truck Backlog
Photo: Boevaya mashina / CC BY-SA 3.0 de via Wikimedia Commons
Answrs VerdictThe committed-demand KPI.
Definition: Hyster-Yale calculates the dollar value of backlog from current unit backlog and the forecasted average sales price per unit; substantially all of it is expected to be sold within twelve monthsHyster-Yale, June 30, 2026: Backlog of approximately $1,580 million versus $1,650 million a year earlier, approaching five months of production (manufacturer, not a dealer)Alta, 2026: Alta said backlog levels remained healthy in the quarter and six months ended June 30, 2026; Not published: it gives no dollar backlogIndustry, 2025: Alta wrote that the North American lift truck industry continued to work through elevated backlogs accumulated during the 2021-2022 supply-chain disruption

Backlog is the dollar value of trucks ordered but not yet delivered. Hyster-Yale reported approximately $1,580 million at June 30, 2026 versus $1,650 million a year earlier, approaching five months of production. Alta reports that backlog levels remained healthy but publishes no dollar figure.

Go ifDealers deciding how many deliveries are already committed for the next two quarters
Skip ifYour sales are mostly parts, service and rental rather than new trucks
Why #3 over #4: It shows committed demand, which bookings do not once deliveries start.
4

North American Lift Truck Orders and Shipments (WITS)
North American Lift Truck Orders and Shipments (WITS)
Photo: JetschkeMarketing / CC BY-SA 4.0 via Wikimedia Commons
Answrs VerdictThe market-volume KPI.
Definition: The World Industrial Truck Statistics program tracks orders and shipments of industrial trucks; the Industrial Truck Association reports North AmericaAmericas, 2025: Orders of 388,195 and shipments of 434,540 industrial trucks of all classes in the Americas region (WITS, July 2026 sheet)Americas, 2024 and 2023: 2024: orders of 347,429 and shipments of 426,061; 2023: orders of 396,236 and shipments of 430,817Class 4/5 internal combustion, 2025: Orders of 106,755 and shipments of 121,646 in the Americas

Industry orders and shipments set the market baseline. The WITS July 2026 sheet shows Americas orders of 388,195 and shipments of 434,540 industrial trucks in 2025, versus orders of 347,429 and shipments of 426,061 in 2024.

Go ifDealers comparing their own unit orders and deliveries with the whole regional market
Skip ifYou need U.S.-only or monthly data; ITA reports to members and the public sheet is quarterly by region
Why #4 over #5: It measures the whole market, which one dealer's sales growth cannot.
5

Material Handling Dealer Segment Gross Margin
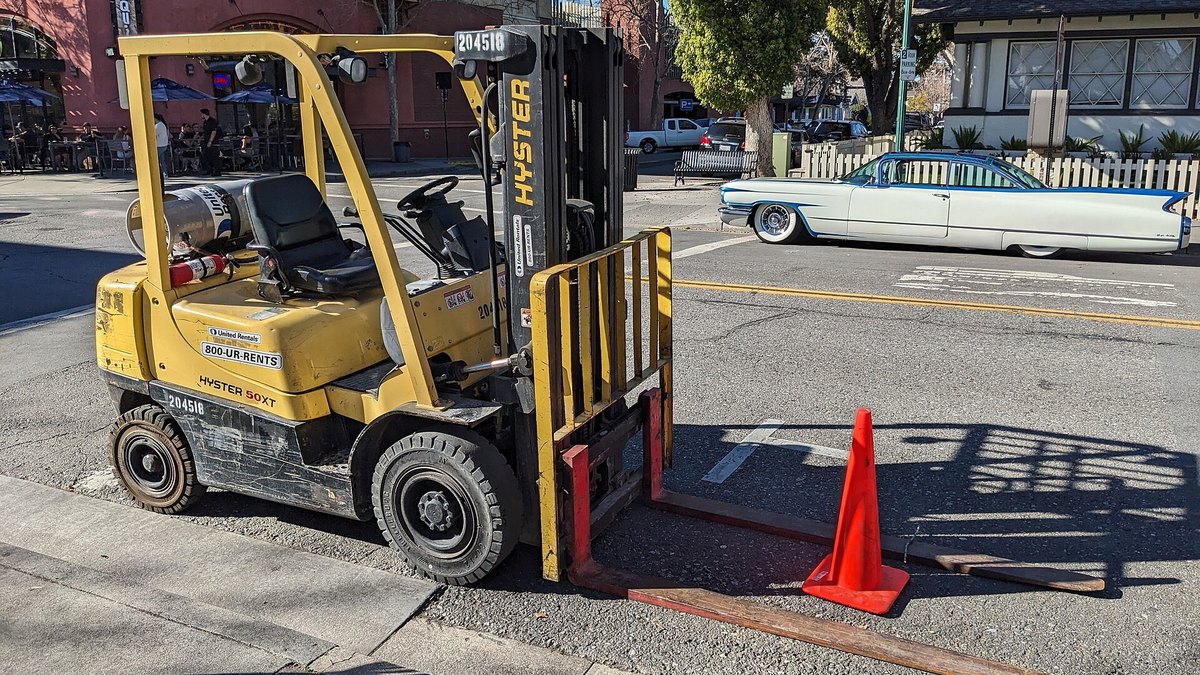
Material Handling Dealer Segment Gross Margin
Photo: Grendelkhan / CC BY-SA 4.0 via Wikimedia Commons
Answrs VerdictThe mix-quality KPI.
Definition: Gross margin ratio is (revenue minus cost of goods sold) divided by revenueAlta, 2025: Material Handling segment gross profit of 33.0% in 2025, up from 32.4% in 2024Alta, 2026: Segment gross profit of 34.5% in the second quarter of 2026 versus 32.7%, and 34.8% for six months versus 33.6%Adjacent segment: Alta's Construction Equipment segment had gross profit of 21.8% in 2025 (construction equipment, not material handling)

Segment gross margin is revenue minus cost of goods sold, divided by revenue. Alta reported 33.0% for Material Handling in 2025, up from 32.4%, and 34.5% in the second quarter of 2026 versus 32.7%.

Go ifOwners judging whether the mix of equipment, parts, service and rental is paying
Skip ifYou want a figure for dealers other than Alta; MHEDA benchmarks are not public
Why #5 over #6: It blends equipment, parts, service and rental, which line-level margins separate.
6

Material Handling Dealer New and Used Lift Truck Gross Margin
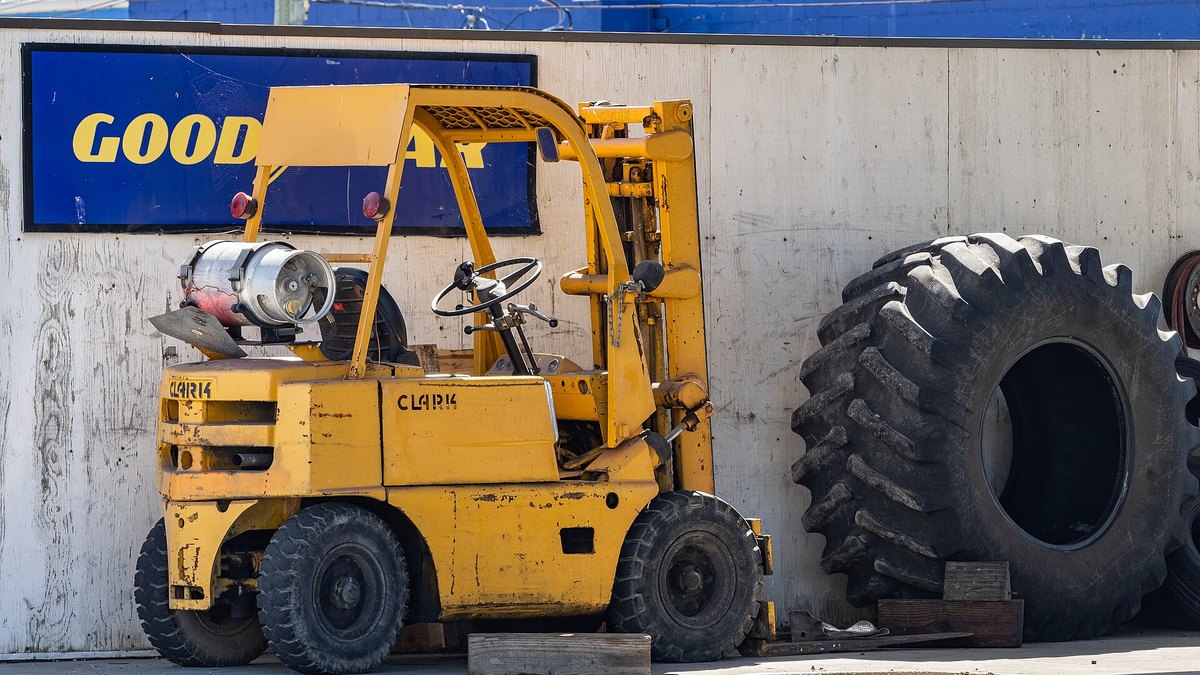
Material Handling Dealer New and Used Lift Truck Gross Margin
Photo: Chris Woodrich / CC BY-SA 4.0 via Wikimedia Commons
Answrs VerdictThe price-realization KPI.
Definition: Gross profit as a percentage of new and used equipment sales revenue, reported by Alta for its Material Handling segmentAlta, 2025: New and used equipment gross margin of 18.1% versus 17.8% in 2024; Alta said tariff-related cost pressures were concentrated in new equipment, where margins held relatively stableAlta, 2026: Margins increased 30 basis points in the second quarter of 2026 and 20 basis points in the six months, remaining largely consistent year over yearUsed equipment: Alta said used equipment margins improved in 2025 on reduced pressure on used equipment pricing

New and used equipment gross margin was 18.1% at Alta in 2025 versus 17.8%. Alta said tariff cost pressures were concentrated in new equipment, where margins held relatively stable, and used equipment margins improved.

Go ifDealers pricing trucks and checking whether discounting or tariffs are eroding the sale
Skip ifYou are comparing against a manufacturer; Hyster-Yale margins include factory costs
Why #6 over #7: It shows price realization on trucks, where parts margin shows aftermarket pricing.
7

Material Handling Dealer Parts Sales and Parts Gross Margin
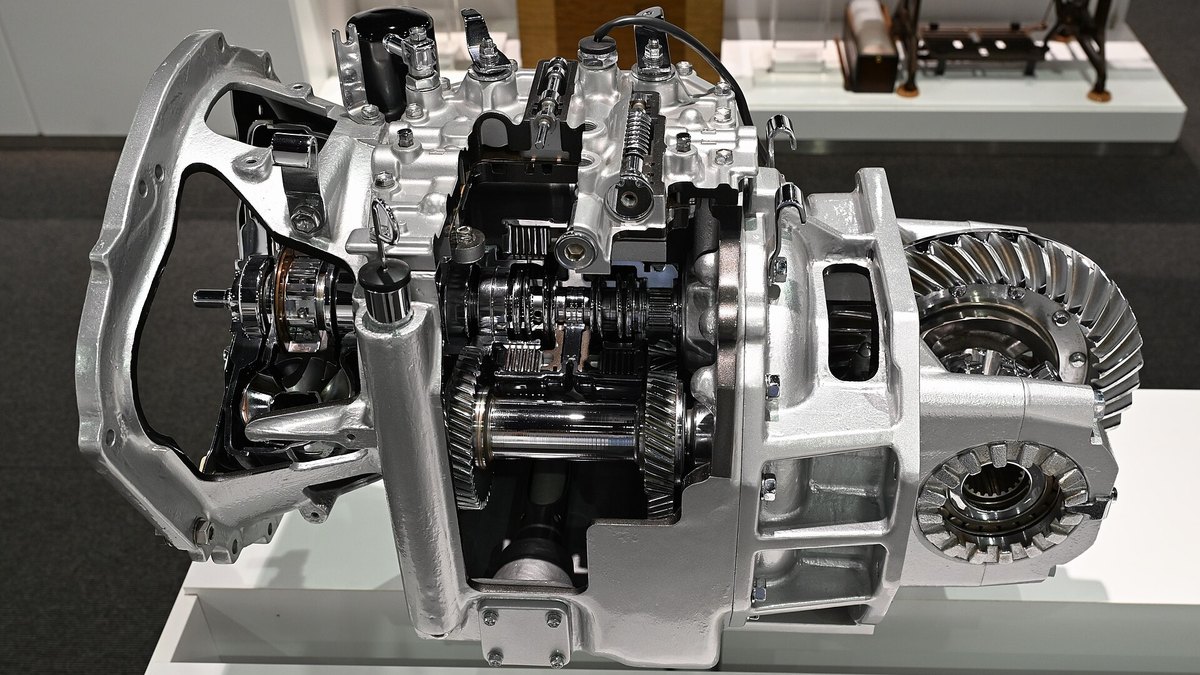
Material Handling Dealer Parts Sales and Parts Gross Margin
Photo: TTTNIS / CC0 via Wikimedia Commons
Answrs VerdictThe aftermarket-volume KPI.
Definition: Alta sells replacement parts to customers and supplies parts to its own rental fleet; the majority of its parts inventory is OEM replacement partsAlta, 2025: Material Handling organic parts sales of $94.0 million versus $99.6 million, down 5.6%; parts gross margin of 38.2% versus 37.1%Alta, Q2 2026: Parts margins declined 80 basis points, reflecting product mix and competitive market conditionsElectrification: Alta said the shift to electric lift trucks reduces mechanical parts consumption per unit

Parts sales and margin track the aftermarket on trucks already sold. Alta Material Handling organic parts sales were $94.0 million in 2025 versus $99.6 million, down 5.6%, with a 38.2% gross margin versus 37.1%. No parts absorption rate is published.

Go ifDealers measuring how much of each truck in the field turns into parts revenue
Skip ifYou need a parts absorption rate; Not published by Alta or MHEDA in the pages read
Why #7 over #8: It measures parts volume, where service margin measures labor.
8

Material Handling Dealer Service Revenue, Service Margin and Technician Utilization
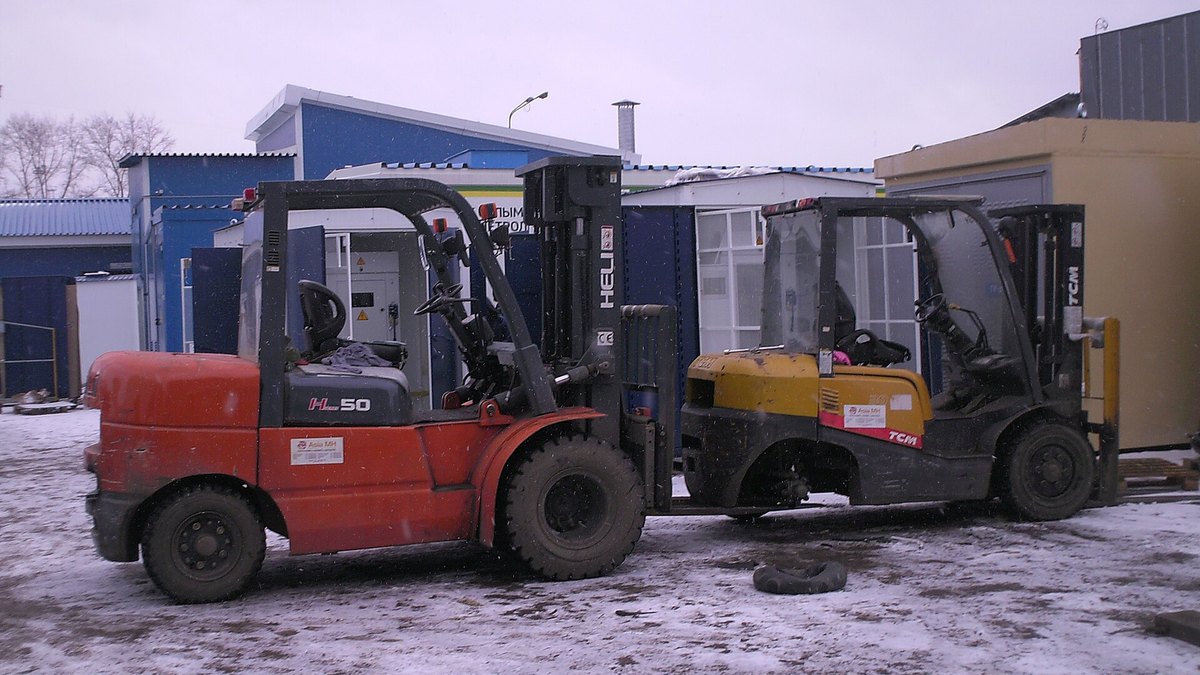
Material Handling Dealer Service Revenue, Service Margin and Technician Utilization
Photo: Апатинаити / CC BY-SA 3.0 via Wikimedia Commons
Answrs VerdictThe service-profit KPI.
Definition: Alta's systems track labor utilization statisticsAlta, 2025: Material Handling organic service revenues of $132.7 million versus $135.9 million, down 2.4%; service gross margin of 59.1% versus 58.6%Alta, Q2 2026: Service margins increased 440 basis points, supported by effective labor rate increases, improved technician utilization and strong service executionTechnicians: About 1,175 skilled technicians among about 2,750 employees at December 31, 2025 (company-wide); Not published: no technician utilization percentage

Service revenue and margin reflect technician productivity. Alta reported organic service revenues of $132.7 million in 2025 versus $135.9 million, a 59.1% gross margin, and service margins up 440 basis points in the second quarter of 2026 on improved technician utilization. No utilization percentage is published.

Go ifDealers deciding whether to add technicians or raise labor rates
Skip ifYou want a utilization percentage; none is published
Why #8 over #9: It shows labor profit, which rental utilization does not.
9

Material Handling Dealer Rental Revenue and Rental Fleet Utilization

Material Handling Dealer Rental Revenue and Rental Fleet Utilization
Photo: TaurusEmerald / CC BY-SA 4.0 via Wikimedia Commons
Answrs VerdictThe fleet-productivity KPI.
Definition: Alta rents equipment on a daily, weekly and monthly basis; its rental fleet original acquisition cost was $529.8 million at December 31, 2025Alta, 2025: Material Handling organic rental revenues of $69.3 million versus $76.2 million, down 9.1%; rental gross margin of 47.3% versus 50.0%Utilization: Alta said North American rental utilization rates moderated during 2024 and into 2025; Not published: no utilization percentage, and it cut rental fleet gross cost by $84.3 million from June 30, 2024 to December 31, 2025Rental equipment sales: Rental equipment sales gross margin of 32.2% versus 27.6%, on disposals of underutilized assets

Rental revenue and fleet utilization show how hard the fleet works. Alta reported organic rental revenues of $69.3 million in 2025, down 9.1%, with a 47.3% gross margin versus 50.0%, and said rental utilization rates moderated. No utilization percentage is published.

Go ifDealers deciding how big a rental fleet to hold against rent-to-sell demand
Skip ifYou do not rent; Alta's utilization percentage is not public and AED rental data is members-only
Why #9 over #10: It measures fleet productivity, where inventory turnover measures stock on the lot.
10

Material Handling Dealer Equipment Inventory Turnover (Inventories-to-Sales)
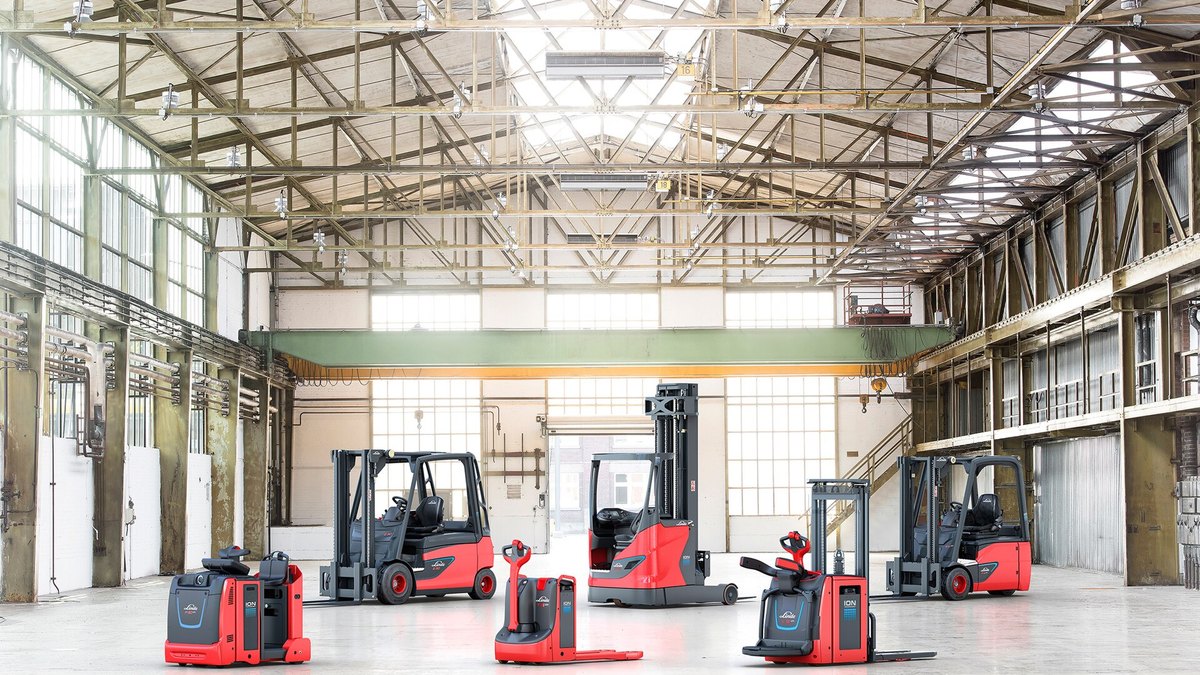
Material Handling Dealer Equipment Inventory Turnover (Inventories-to-Sales)
Photo: Patricklorek / CC BY-SA 4.0 via Wikimedia Commons
Answrs VerdictThe stock-velocity KPI.
Definition: Inventory turnover ratio is cost of goods sold divided by average inventory; the Census inventories/sales ratio is the dollar value of inventories divided by the dollar value of salesAdjacent category: machinery wholesalers: Census inventories/sales ratio of 0.77 for August 2026 versus 0.83 for August 2025 for machinery wholesalers (NAICS 4238, all machinery, equipment and supplies, not lift trucks alone)All wholesalers: Inventories/sales ratio of 1.18 for August 2026 versus 1.28 for August 2025 across all U.S. merchant wholesalersAlta, 2025: Reduced new equipment inventory by $51.5 million year over year in 2025 (company-wide, including construction equipment)

Inventory turnover is cost of goods sold divided by average inventory. For context only, Census put the inventories/sales ratio of machinery wholesalers at 0.77 in August 2026 versus 0.83, and all wholesalers at 1.18. Alta cut new equipment inventory by $51.5 million in 2025.

Go ifDealers deciding how many new and used trucks to hold on the lot
Skip ifYou need a lift truck dealer turnover; MHEDA surveys it but its results are not public

How we ranked these

We ranked ten sales KPIs for commercial material handling equipment dealers by how directly each measures dealer sales and whether a public source states a figure for it. Dealer data comes from Alta Equipment Group, the only public lift truck dealer found: its 2025 Form 10-K (filed in February 2026) and its quarterly report for June 30, 2026 (filed in August 2026). Manufacturer data comes from the Hyster-Yale quarterly report for June 30, 2026 (filed in August 2026). Market data comes from the World Industrial Truck Statistics sheet of July 2026, which the Industrial Truck Association contributes to, and the Census Bureau wholesale release of October 2026. The Hyster-Yale, WITS and Census figures are from a manufacturer, a regional industry count and an adjacent wholesale category, so they are context, not dealer benchmarks. KPI definitions come from those filings, Corporate Finance Institute and Census. MHEDA's annual benchmarking survey covers growth, gross margin, expenses and inventory turnover, but its results are not public. Where no number is published we say so instead of estimating. Facts are taken from each maker's own published information; check the official site before you buy.

Questions people ask

What is the gross margin of a material handling equipment dealer?

Alta Equipment Group reported Material Handling segment gross profit of 33.0% in 2025, with 18.1% on new and used equipment, 38.2% on parts, 59.1% on service and 47.3% on rental.

How much did lift truck dealer equipment sales change recently?

Alta reported organic new and used equipment sales in Material Handling down 7.7% in 2025 and down 5.0% in the second quarter of 2026.

How big is the lift truck backlog?

Hyster-Yale, a manufacturer, reported backlog of approximately $1,580 million at June 30, 2026, versus $1,650 million a year earlier.

How many industrial trucks are ordered and shipped in the Americas?

The WITS July 2026 sheet shows 2025 Americas orders of 388,195 and shipments of 434,540 across all industrial truck classes.

Alta Material Handling gross margin by revenue line, 2025, percent at a glance

New and used equipment, 2025 gross margin18.1 %
Rental equipment sales, 2025 gross margin32.2 %
Segment, 2025 gross margin33 %
Parts, 2025 gross margin38.2 %
Rental, 2025 gross margin47.3 %
Service, 2025 gross margin59.1 %
Alta Material Handling gross margin by revenue line, 2025, percent, as published by each maker. Picks without a published figure are left off.

Official sites

Sources

Prices, specs and availability change; confirm on the official site before you buy.

Share this page