Top 10 Sales KPIs in the Commercial Restaurant Equipment Distribution Industry in 2027
By Kory White · Updated Nov 2026 · 5 min read
Direct answer
Sales growth is the top sales KPI for a commercial restaurant equipment distributor in 2027, followed by gross margin and sales per employee. The FEDA 2024 Financial Benchmarking Survey, using 2023 data, reported sales change of 9.2% for the typical dealer, gross margin of 23.1% and sales per employee of $658,882. FE&S reported top 100 dealer sales of $16.49 billion in 2025, up 4.72%. Where no figure is published, this page says so.
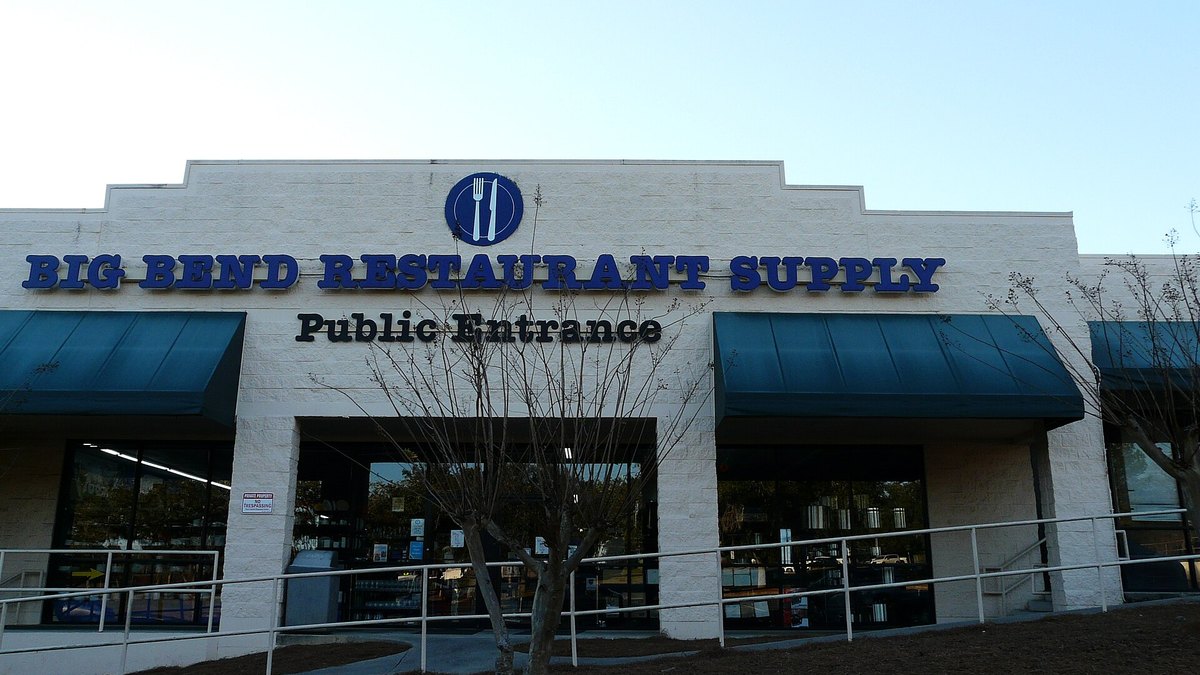
Photo: The Bushranger / CC BY-SA 4.0 via Wikimedia Commons
Answrs VerdictThe headline sales KPI.
Definition: Change in a dealer's sales from the prior year; the FEDA benchmarking survey reports it as Sales ChangeFEDA dealers, 2023: Sales change of 9.2% for the typical dealer and 12.7% for high-profit dealers, versus 23.1% and 26.2% in 2022 (FEDA 2024 Financial Benchmarking Survey)Top 100 dealers, 2025: Sales among the top 100 foodservice equipment and supplies dealers totaled $16.49 billion in 2025, up 4.72% from 2024 (FE&S)Manufacturer view, Q2 2026: Middleby Commercial Foodservice grew 8.3% organically in Q2 2026; organic growth excludes acquisitions and foreign exchange (manufacturer, not a dealer)
Sales growth is the change in a dealer's sales from the prior year. The FEDA benchmarking survey reported 9.2% for the typical dealer and 12.7% for high-profit dealers in 2023, and FE&S reported top 100 dealer sales up 4.72% to $16.49 billion in 2025. Middleby's Commercial Foodservice group, a manufacturer, grew 8.3% organically in Q2 2026.
Go ifAny dealer wanting to know whether it is growing faster than the market
Skip ifYou need a current-year dealer figure; FEDA's latest published dealer data covers 2023
Why #1 over #2: It shows whether the dealership is gaining share, which gross margin alone cannot.
2
Restaurant Equipment Dealer Gross Margin
Photo: Shrinks99 / CC0 via Wikimedia Commons
Answrs VerdictThe price-realization KPI.
Definition: Gross margin ratio is (revenue minus cost of goods sold) divided by revenueFEDA dealers, 2023: Gross margin of 23.1% for the typical dealer and 23.3% for high-profit dealers (FEDA 2024 Financial Benchmarking Survey)Profit drivers: FEDA names sales growth, gross margin, operating expenses and inventory turnover as the most important KPIs for enhancing profitSpread: FEDA's survey shows the two dealer groups nearly identical on gross margin, with other KPIs separating them
Gross margin is revenue minus cost of goods sold, divided by revenue. FEDA reported 23.1% for the typical dealer and 23.3% for high-profit dealers in 2023, and names it one of four KPIs that enhance profit.
Go ifDealers pricing quotes and judging whether discounting is eroding the sale
Skip ifYou want what separates winners; gross margin was nearly identical across FEDA groups
Why #2 over #3: It shows price realization on each sale, which sales per employee does not.
3
Restaurant Equipment Dealer Sales per Employee
Photo: Eric Polk / CC BY-SA 4.0 via Wikimedia Commons
Answrs VerdictThe sales-productivity KPI.
Definition: An efficiency ratio used to determine the revenue generated per individual working at a companyFEDA dealers, 2023: Sales per employee of $658,882 for the typical dealer and $798,089 for high-profit dealers (FEDA 2024 Financial Benchmarking Survey)Gap: FEDA says high-profit dealers generated nearly $140,000 more sales per employeePayroll: Payroll expense of 11.9% for the typical dealer versus 10.0% for high-profit dealers
Sales per employee measures revenue per person at the company. FEDA reported $658,882 for the typical dealer and $798,089 for high-profit dealers in 2023, a gap of nearly $140,000.
Go ifDealers deciding whether sales staff, designers and service techs are paying for themselves
Skip ifYour headcount includes large non-sales teams that distort the ratio
Why #3 over #4: It ties sales to staffing, which total net sales hide.
4
Restaurant Equipment Dealer Annual Net Sales
Photo: Pohled 111 / CC BY-SA 4.0 via Wikimedia Commons
Answrs VerdictThe scale KPI.
Definition: A dealer's annual sales; FE&S ranks the top 100 foodservice equipment and supplies dealers by sales each yearFEDA typical dealer, 2023: Typical dealer sales of $29.2 million in 2023 (FEDA 2024 Financial Benchmarking Survey)Wasserstrom, 2025: Wasserstrom Co. sales of $769.40 million in 2025 versus $716.00 million in 2024 (FE&S)Largest dealers, 2025: Clark Associates $3,972.32 million and TriMark USA $2,229.00 million in 2025 sales (FE&S)
Annual sales size a dealer. FEDA reported typical dealer sales of $29.2 million in 2023, while FE&S put Wasserstrom Co. at $769.40 million in 2025, TriMark USA at $2,229.00 million and Clark Associates at $3,972.32 million.
Go ifPlacing your dealership against the typical FEDA member and the top 100
Skip ifYou want sales that are comparable across dealers; FE&S marks some figures as estimates
Why #4 over #5: It sets the scale of the business, while category growth shows only direction.
5
Foodservice Equipment Sales Growth by Product Category
Photo: Nick Saltmarsh / CC BY 2.0 via Wikimedia Commons
Answrs VerdictThe product-mix KPI.
Definition: Sales growth for each product category (equipment, supplies, tabletop, furniture), tracked by the MAFSI Business BarometerQ2 2026: Furniture 5.2%, supplies 3.0%, equipment 1.8% and tabletop 0.6%, with total foodservice equipment and supplies sales up 2.0% (MAFSI via FEDA)Q3 2025: Tabletop 3.3%, furniture 2.6%, equipment 1.9% and supplies 1.5%, with total sales up 2.1% (MAFSI via FEDA)Streak: Q2 2026 was the 12th straight quarter in which sales neither exceeded 2.4% growth nor fell by more than 1%
MAFSI tracks sales growth by product category. In Q2 2026 furniture grew 5.2%, supplies 3.0%, equipment 1.8% and tabletop 0.6%, with total sales up 2.0%. In Q3 2025 tabletop led at 3.3%.
Go ifDealers deciding whether to push equipment, smallwares or furniture
Skip ifYou need dealer-level mix; the figures are from manufacturers' agents
Why #5 over #6: It shows which product lines carry growth, which the project pipeline does not.
6
Foodservice Quoting Activity and Construction Project Pipeline
Photo: Travelarz / CC BY-SA 3.0 pl via Wikimedia Commons
Answrs VerdictThe leading-indicator KPI.
Definition: Quoting and consultant activity reported by MAFSI reps, plus the number of foodservice construction projects counted by SpecPathQ2 2026: Quoting activity growth slowed from 44% to 33%; SpecPath counted 785 projects in Q2 versus 880 in Q1, an 11% declineTwelve months to Q2 2026: Projects fell from 3,698 to 3,272, a 12% declineQ3 2025: 824 projects versus 950 a year earlier, a 13.3% decrease
Quoting activity and project counts lead equipment orders. SpecPath counted 785 projects in Q2 2026 versus 880 in Q1, an 11% decline, and quoting activity growth slowed from 44% to 33%. Over twelve months projects fell from 3,698 to 3,272.
Go ifDealers forecasting the next two quarters of project-driven equipment orders
Skip ifYour sales are mostly replacement and repair orders rather than new projects
Why #6 over #7: It looks forward at demand, where inventory turnover looks back at stock.
7
Restaurant Equipment Dealer Inventory Turnover
Photo: Wikimedia Commons contributor / CC BY-SA 3.0 via Wikimedia Commons
Answrs VerdictThe stock-velocity KPI.
Definition: Inventory turnover ratio is cost of goods sold divided by average inventoryFEDA dealers, 2023: Inventory turnover of 4.3 for the typical dealer and 4.9 for high-profit dealers (FEDA 2024 Financial Benchmarking Survey)Adjacent category: all wholesalers: Census inventories/sales ratio of 1.18 for August 2026 versus 1.28 for August 2025, covering all U.S. merchant wholesalers, not restaurant equipment aloneCensus definition: Inventories/sales ratio is the dollar value of inventories divided by the dollar value of sales
Inventory turnover is cost of goods sold divided by average inventory. FEDA reported 4.3 for the typical dealer and 4.9 for high-profit dealers in 2023. For context only, Census put the inventories/sales ratio of all U.S. merchant wholesalers at 1.18 in August 2026.
Go ifDealers deciding how much stock to hold against how fast it sells
Skip ifYou sell mostly special-order equipment with little stock on the floor
Why #7 over #8: It shows how fast stock converts to sales, which collection period does not.
8
Restaurant Equipment Dealer Average Collection Period
Photo: Pohled 111 / CC BY-SA 4.0 via Wikimedia Commons
Answrs VerdictThe cash-conversion KPI.
Definition: The time it takes, on average, to receive payments owed by customers: accounts receivable divided by total net sales for the year, times 365FEDA dealers, 2023: Average collection period of 36.3 days for the typical dealer and 28.1 days for high-profit dealers (FEDA 2024 Financial Benchmarking Survey)Return on assets: Return on assets of 11.3% for the typical dealer and 26.2% for high-profit dealersOther sources: Not published: no collection-period benchmark for restaurant equipment dealers was found outside FEDA
Average collection period is accounts receivable divided by net sales, times 365. FEDA reported 36.3 days for the typical dealer and 28.1 days for high-profit dealers in 2023. No other restaurant equipment benchmark was found.
Go ifDealers selling on terms to restaurant groups, institutions and contractors
Skip ifYou are paid in full before delivery
Why #8 over #9: It shows when a sale turns into cash, which profit margin does not.
9
Restaurant Equipment Dealer Pre-Tax Profit Margin
Photo: Charles Haynes / CC BY-SA 2.0 via Wikimedia Commons
Answrs VerdictThe sales-to-profit KPI.
Definition: Typical dealer profit margin of 3.9% means about 4 cents of profit for every dollar of salesFEDA dealers, 2023: Pre-tax profit margin of 3.9% for the typical dealer and 8.2% for high-profit dealers, more than doubleNon-payroll expenses: Non-payroll expenses of 7.4% for the typical dealer versus 5.3% for high-profit dealers2026 survey: FEDA opened its 2026 Profit Survey in May 2026 with a July 3, 2026 deadline; results were not published in the pages read
Pre-tax profit margin was 3.9% for the typical FEDA dealer and 8.2% for high-profit dealers in 2023, about 4 cents of profit per dollar of sales for the typical dealer. FEDA's 2026 survey results were not published in the pages read.
Go ifOwners checking whether sales growth is turning into profit
Skip ifYou want 2025 dealer data; none has been published
Why #9 over #10: It shows what sales leave after expenses, which forecast accuracy does not.
10
Foodservice Equipment Sales Forecast vs Actual
Photo: Diego F. Parra / CC BY-SA 4.0 via Wikimedia Commons
Answrs VerdictThe forecast-accuracy KPI.
Definition: Actual quarterly sales growth compared with the growth MAFSI projected for that quarterQ1 2026: Sales up 1% for the quarter, short of the 3.5% growth MAFSI had projectedQ2 2026: Sales grew 2.0%, beating MAFSI's earlier projection of 1.5%Q3 2025: Sales grew 2.1% against a 2.7% forecastOutlook: MAFSI forecast 2.7% growth for Q3 2026 and said yearly sales could rise 4.3% compared with 2025
MAFSI projected 3.5% growth for Q1 2026 and sales rose 1%. For Q2 2026 it projected 1.5% and sales grew 2.0%; for Q3 2025 it forecast 2.7% against 2.1% actual. It forecasts 2.7% for Q3 2026.
Go ifDealers setting quarterly targets and checking how reliable market forecasts have been
Skip ifYou plan only from your own backlog
How we ranked these
We ranked ten sales KPIs for commercial restaurant equipment distributors by how directly each measures dealer sales and whether a trade source publishes a figure for it. Dealer benchmarks come from the FEDA 2024 Financial Benchmarking Survey (2023 data, published May 2025), the only dealer-level benchmark set found. Market data comes from MAFSI Business Barometer results reported by FEDA on November 2025, May 2026 and September 2026, the FE&S 2026 Distribution Giants study (April 2026), the Middleby second quarter 2026 release (August 2026) and the Census Bureau August 2026 wholesale report. The Middleby and Census figures are from a manufacturer and from all wholesalers, so they are context, not dealer benchmarks. KPI definitions come from Corporate Finance Institute, FEDA and Census. FEDA reports typical and high-profit dealers; where no number is published we say so instead of estimating. Facts are taken from each maker's own published information; check the official site before you buy.
Questions people ask
What is the typical gross margin for a restaurant equipment dealer?
The FEDA 2024 Financial Benchmarking Survey, using 2023 data, reported gross margin of 23.1% for the typical dealer and 23.3% for high-profit dealers.
How much do restaurant equipment dealers sell per employee?
FEDA reported sales per employee of $658,882 for the typical dealer and $798,089 for high-profit dealers in its 2023 data.
How fast is foodservice equipment and supplies sales growth?
MAFSI reported sales growth of 2.0% in Q2 2026, with equipment up 1.8% and supplies up 3.0%, as reported by FEDA.
How big are the largest restaurant equipment distributors?
FE&S reported 2025 sales of $3,972.32 million for Clark Associates, $2,229.00 million for TriMark USA and $769.40 million for Wasserstrom Co.
Sales growth rates in foodservice equipment distribution, percent at a glance