Top 10 Sales KPIs in the Credit Card Industry in 2027
By Kory White · Updated Oct 2026 · 4 min read
Direct answer
Card purchase volume is the top credit card sales KPI in 2027, followed by interchange revenue and active accounts. In Q2 2026 JPMorgan Card Services reported $373.1 billion of sales volume and Citi USCC earned $2,740 million of interchange fees, while no issuer publishes interchange per active account. Where the filings give no benchmark, this page says so.
Dollar amount of card member purchases, net of returns, in the period (JPMorgan definition of debit and credit card sales volume; Capital One excludes cash advances and balance transfers)
Any issuer or partner: spend is the base that interchange, rewards costs and revolving balances all grow from
Interchange revenue in the period divided by average active accounts, with active accounts counting those with a purchase, payment or balance in the month (Synchrony definition)
Issuers judging how much each account earns from merchants, which a total revenue line hides
Annualized net charge-offs divided by average loans; American Express uses principal losses only and Bread calls it the net principal loss rate
Judging whether card sales are profitable once credit losses are counted
Pick by what you want
Best overall
Card Purchase Volume
Best for merchant fees
Interchange and Discount Revenue
Best for account value
Interchange Revenue per Active Account
Best for lending income
Net Interest Margin on Card Loans
Best for credit cost
Net Charge-Off Rate
The ranking
1
Card Purchase Volume
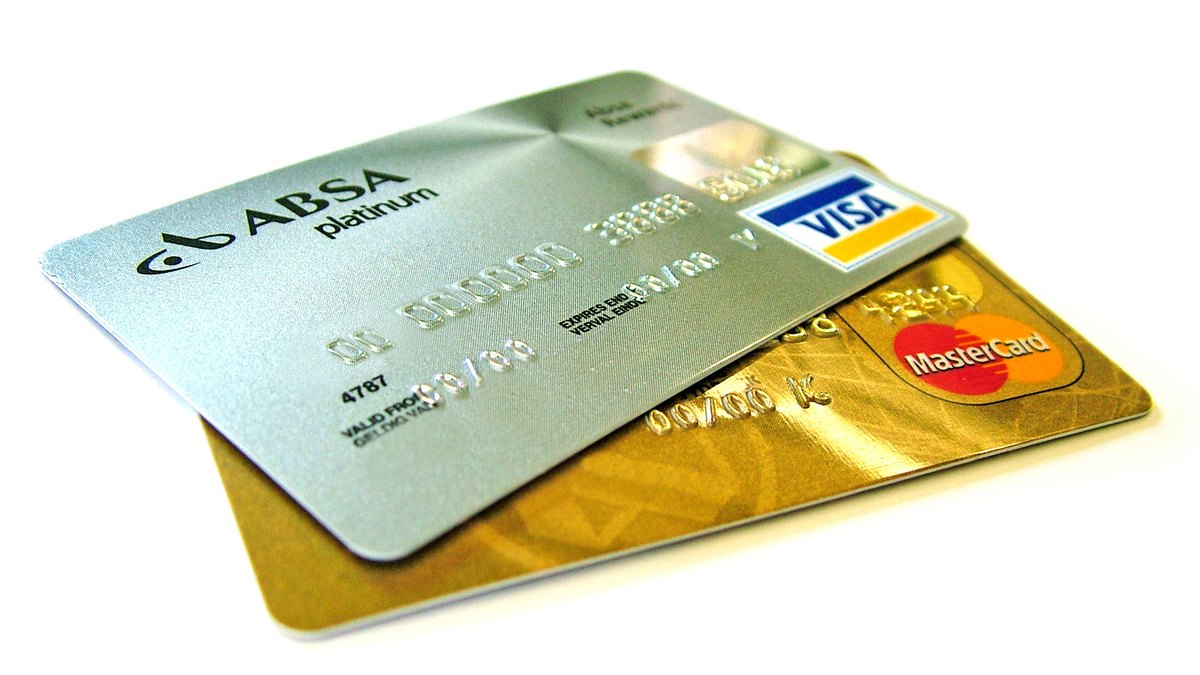
Photo: Mike Mozart from Funny YouTube, USA / CC BY 2.0 via Wikimedia Commons
Answrs VerdictThe headline sales KPI.
Formula: Dollar amount of card member purchases, net of returns, in the period (JPMorgan definition of debit and credit card sales volume; Capital One excludes cash advances and balance transfers)JPMorgan Card Services, Q2 2026: Sales volume, excluding commercial card, of $373.1 billion, up 10% from $340.0 billion in Q2 2025Capital One Credit Card, Q2 2026: Purchase volume of $253,750 million, up 26% from $201,453 million a year earlier; Discover merged into Capital One on May 18, 2025Synchrony, Q2 2026: Purchase volume of $49,827 million, up 8.1% and described by the company as recordAmerican Express, Q2 2026: Billed business of $455.8 billion, up 9% from $416.3 billion
Purchase volume is how much cardholders spend. JPMorgan Card Services reported $373.1 billion of sales volume in Q2 2026, up 10%, Capital One $253,750 million and Synchrony $49,827 million.
Go ifAny issuer or partner: spend is the base that interchange, rewards costs and revolving balances all grow from
Skip ifYou compare issuers directly; each defines volume differently and Capital One’s growth includes Discover
Why #1 over #2: Every other KPI on the page grows from spend, which is why it ranks first.
2
Interchange and Discount Revenue
Photo: Hloom Templates / CC BY 2.0 via Wikimedia Commons
Answrs VerdictThe merchant-fee KPI.
Formula: Fees paid by merchants on card purchases, reported before or net of rewards and partner payments depending on the issuerCiti USCC, Q2 2026: Interchange fees of $2,740 million, up 11% from $2,459 million, against card rewards and partner payments of $3,563 millionAmerican Express, Q2 2026: Discount revenue of $10,163 million, up 9% from $9,361 millionCapital One, Q2 2026: Discount and interchange fees, net, of $2,256 million, up 53% from $1,478 million (company-wide)Synchrony, Q2 2026: Interchange revenue of $300 million, up 11.9% from $268 millionFederal Reserve, debit only, 2023: Interchange fees across all debit and general-use prepaid card transactions totaled $34.12 billion in 2023; Regulation II covers debit, not credit
Interchange and discount revenue is what merchants pay on that spend. American Express reported $10,163 million of discount revenue and Citi USCC $2,740 million of interchange, against $3,563 million of rewards and partner payments.
Go ifIssuers and card networks measuring what spend earns before the cost of rewards
Skip ifYou need a like-for-like figure: Citi shows gross interchange, Capital One shows it net, and the Fed series is debit only
Why #2 over #3: It prices the spend, but rewards costs can absorb most of it, so volume ranks higher.
3
Interchange Revenue per Active Account
Photo: Anselm Schüler / CC BY-SA 4.0 via Wikimedia Commons
Answrs VerdictThe per-account KPI.
Formula: Interchange revenue in the period divided by average active accounts, with active accounts counting those with a purchase, payment or balance in the month (Synchrony definition)Synchrony inputs, Q2 2026: Interchange revenue of $300 million and average active accounts of 68,341 thousandCalculated here, not stated by Synchrony: About $4.39 of interchange per average active account for the quarter, from $300 million divided by 68.341 million accountsCiti inputs, Q2 2026: USCC interchange fees of $2,740 million before $3,563 million of card rewards and partner payments; average active accounts of 47,446 thousand for GPCC and 21,718 thousand for PLCCPublished per-account figure: None found: no issuer cited here states interchange per active account
Interchange per active account shows what each account earns from merchants. No issuer states it; Synchrony’s $300 million of interchange across 68,341 thousand average active accounts implies about $4.39 for the quarter.
Go ifIssuers judging how much each account earns from merchants, which a total revenue line hides
Skip ifYou need a reported number; this ratio is derived and issuers define accounts differently
Why #3 over #4: It is the old Pulse question, but it is derived rather than reported, so it ranks below reported totals.
4
Active Accounts and Cards-in-Force
Photo: TheDigitalWay / CC0 via Wikimedia Commons
Answrs VerdictThe base-size KPI.
Formula: Cards issued and outstanding, or accounts with a purchase, payment or balance in the period, depending on the issuerAmerican Express, Q2 2026: Cards-in-force of 155.1 million, up 4% from 149.4 million; proprietary cards-in-force of 87.6 million, up 3%Synchrony, Q2 2026: Average active accounts of 68.3 million, flat on a year earlier, and period-end active accounts of 68,410 thousandCiti USCC, Q2 2026: Average active accounts of 47,446 thousand for GPCC, up 6%, and 21,718 thousand for PLCC, down 8%
Active accounts and cards-in-force size the base. American Express had 155.1 million cards-in-force, Synchrony 68.3 million average active accounts and Citi GPCC 47,446 thousand.
Go ifSizing the base that spend, interchange and balances are measured against
Skip ifYou compare across issuers: cards-in-force and active accounts are different counts
Why #4 over #5: A count of accounts says who can spend, but not how much, so it ranks below volume.
5
Average Spend per Card
Photo: Shixart1985 / CC BY 2.0 via Wikimedia Commons
Answrs VerdictThe spend-intensity KPI.
Formula: Spending on cards divided by the cards or accounts that generate it; American Express reports average proprietary basic Card Member spendingAmerican Express, Q2 2026: Average proprietary basic Card Member spending of $6,759, up 6% from $6,370 in Q2 2025Synchrony, Q2 2026: Management said higher spend per account across each of its five sales platforms drove record purchase volume; no dollar figure is givenBread Financial, Q2 2026: Co-brand credit card programs have higher credit sales per account than private label programs, per its 10-Q; no dollar figure is given
Average spend per card shows intensity. American Express reported $6,759 of average proprietary basic Card Member spending in Q2 2026, up 6%; Synchrony credited higher spend per account for record purchase volume.
Go ifIssuers and partners judging whether growth comes from more cards or heavier use
Skip ifYou need a number for every issuer; only American Express publishes one here
Why #5 over #6: It splits volume into cards and use, but only American Express publishes a dollar figure.
6
New Account Acquisition
Photo: Lotus Head from Johannesburg, Gauteng, South Africa / CC BY-SA 2.5 via Wikimedia Commons
Answrs VerdictThe growth-in-base KPI.
Formula: Number of new credit card accounts opened or acquired in the period (Citi definition); American Express counts new cards issued, net of replacementsCiti GPCC, Q2 2026: 4,004 thousand new account acquisitions versus 1,704 thousand a year earlier, including the additional American Airlines co-branded portfolio acquired in April 2026Citi PLCC, Q2 2026: 1,372 thousand new account acquisitions, down 12% from 1,551 thousandAmerican Express, Q2 2026: Proprietary new cards acquired of 3.0 million versus 3.1 million in Q2 2025
New account acquisition shows how fast sales widen the base. Citi GPCC opened or acquired 4,004 thousand accounts in Q2 2026, including an acquired portfolio, while American Express acquired 3.0 million new cards.
Go ifIssuers and partners tracking how fast sales are widening the account base
Skip ifYou need clean organic growth; Citi’s count includes acquired accounts
Why #6 over #7: It drives future volume, but acquired accounts blur the organic signal.
7
Card Loan Growth
Photo: Cbaile19 / CC0 via Wikimedia Commons
Answrs VerdictThe balance-growth KPI.
Formula: Period-end card loans or balances against the same date a year earlierJPMorgan Card Services, June 30, 2026: Period-end loans of $249,816 million, up 7% from $233,051 millionAmerican Express, June 30, 2026: Total Card balances and Other loans of $229,481 million, up 8% from $211,976 millionSynchrony, June 30, 2026: Loan receivables of $102.2 billion, up 2.4%Federal Reserve G.19, August 2026: Revolving consumer credit decreased at an annual rate of 4.2% in August, with $1,352.4 billion outstanding (preliminary)
Card loan growth shows balances building. JPMorgan Card Services loans rose 7% to $249,816 million and American Express card balances and other loans rose 8% to $229,481 million.
Go ifIssuers earning net interest income, where balances are the largest revenue driver
Skip ifYou track a sales-only KPI; loan growth also reflects payment rates and portfolio purchases
Why #7 over #8: It drives interest income, but it reflects payment behavior as well as sales.
8
Net Interest Margin on Card Loans
Photo: Gewild / CC0 via Wikimedia Commons
Answrs VerdictThe lending-profit KPI.
Formula: Annualized net interest income divided by average interest-earning assets (Synchrony and Bread definition)Synchrony, Q2 2026: Net interest margin of 15.08%, up 30 basis points from 14.78%Bread Financial, Q2 2026: Net interest margin of 18.49%, up from 17.71%American Express, Q2 2026: Net interest yield of 8.1% versus 7.9% a year earlierCapital One, Q2 2026: Company-wide net interest margin of 8.01%, up from 7.62%; not a card-only figure
Net interest margin shows lending profit. Synchrony reported 15.08% and Bread Financial 18.49% for Q2 2026, while American Express net interest yield was 8.1%.
Go ifRevolving-balance lenders, where interest is the main source of card revenue
Skip ifYou compare across issuers: asset bases and definitions differ and Capital One’s is not card-only
Why #8 over #9: It matters for revolvers, but it is a profit measure rather than a sales measure.
9
Card Revenue Yield
Photo: Epolk / CC BY-SA 4.0 via Wikimedia Commons
Answrs VerdictThe revenue-per-dollar KPI.
Formula: Annualized card revenue divided by average loans (JPMorgan net revenue rate; Capital One total net revenue margin; Citi revenue rate)JPMorgan Card Services, Q2 2026: Net revenue rate of 10.37%, up from 10.06%Citi USCC, Q2 2026: Revenue rate of 10.25%, down from 10.67%Capital One Credit Card, Q2 2026: Total net revenue margin of 17.35%, unchanged from Q2 2025Synchrony, Q2 2026: Total loan receivables yield of 21.43% from interest and fees
Revenue yield shows revenue per dollar of loans. JPMorgan Card Services reported a 10.37% net revenue rate, Citi USCC 10.25% and Capital One Credit Card 17.35%.
Go ifComparing how much revenue each dollar of card loans produces
Skip ifYou compare across issuers: the denominators differ (average loans versus interest-earning assets)
Why #9 over #10: It blends interest and fees, but the denominators differ by issuer.
10
Net Charge-Off Rate
Photo: Suiren2022 / CC BY-SA 4.0 via Wikimedia Commons
Answrs VerdictThe cost-of-sales KPI.
Formula: Annualized net charge-offs divided by average loans; American Express uses principal losses only and Bread calls it the net principal loss rateCapital One Credit Card, Q2 2026: Net charge-off rate of 4.71%, down from 5.20% a year earlierSynchrony, Q2 2026: Net charge-offs of 5.43% of average loan receivables, versus 5.70%JPMorgan Card Services, Q2 2026: Net charge-off rate of 3.34%, versus 3.40%Citi USCC, Q2 2026: Net credit losses of 4.19% of average loans, versus 4.43%American Express, Q2 2026: Net write-off rate on principal only of 2.0%, flat year over year; Bread Financial’s net principal loss rate was 6.98%
Net charge-off rate is the cost side of every sale. It ranged from 2.0% at American Express on principal only to 5.43% at Synchrony and 6.98% at Bread Financial in Q2 2026.
Go ifJudging whether card sales are profitable once credit losses are counted
Skip ifYou need a sales KPI on its own; this is the cost side of every sale
How we ranked these
We ranked KPIs on how directly they drive credit card sales and how clearly issuer filings define them, using Q2 2026 filings with the SEC by American Express, Capital One, Synchrony, JPMorgan Chase, Citigroup and Bread Financial, plus Federal Reserve G.19 and Regulation II data. Each figure is labeled with whose it is and which period it covers. Where no benchmark is published, the page says so. Facts are taken from each maker's own published information; check the official site before you buy.
Questions people ask
What are the most important sales KPIs in the credit card industry?
Purchase volume, interchange revenue, active accounts and new accounts show how much cardholders spend and what that earns. In Q2 2026 JPMorgan Card Services reported $373.1 billion of sales volume and American Express billed business was $455.8 billion.
Do issuers report interchange revenue per active account?
No issuer cited here states it. Synchrony reported $300 million of interchange revenue and 68,341 thousand average active accounts in Q2 2026, so the ratio can be calculated, but it is derived.
How much interchange does a card issuer earn?
Citi reported $2,740 million of interchange fees in USCC in Q2 2026, but paid $3,563 million in card rewards and partner payments. The Federal Reserve measured $34.12 billion of debit interchange in 2023.
Does Discover still report separately?
Not in the filings cited here. Discover merged into Capital One on May 18, 2025, so its card results sit inside Capital One’s Credit Card segment.
Card net charge-off rate by issuer, Q2 2026 (definitions differ) at a glance
American Express (principal only)2 %
JPMorgan Card Services3.34 %
Citi USCC4.19 %
Capital One Credit Card4.71 %
Synchrony5.43 %
Bread Financial (principal loss)6.98 %
Card net charge-off rate by issuer, Q2 2026 (definitions differ), as published by each maker. Picks without a published figure are left off.