Comparable store sales growth is the top sales KPI in the grocery industry in 2027, followed by gross margin and average basket size. Kroger reported identical sales without fuel up 2.9% in fiscal 2025, Albertsons 2.0% and Sprouts 7.3%; gross margins ran from 22.9% at Kroger to 38.8% at Sprouts. Where no source publishes a benchmark, this page says so.
Cost of goods sold divided by average inventory at cost
Operators managing perishables, ordering and cash tied up in stock
Pick by what you want
Best overall
Grocery Comparable Store Sales Growth
Best for pricing
Grocery Gross Margin Percentage
Best for basket building
Grocery Average Basket Size
Best for online ordering
Grocery E-Commerce Sales Share
Best for store brands
Grocery Private-Label Penetration
The ranking
1
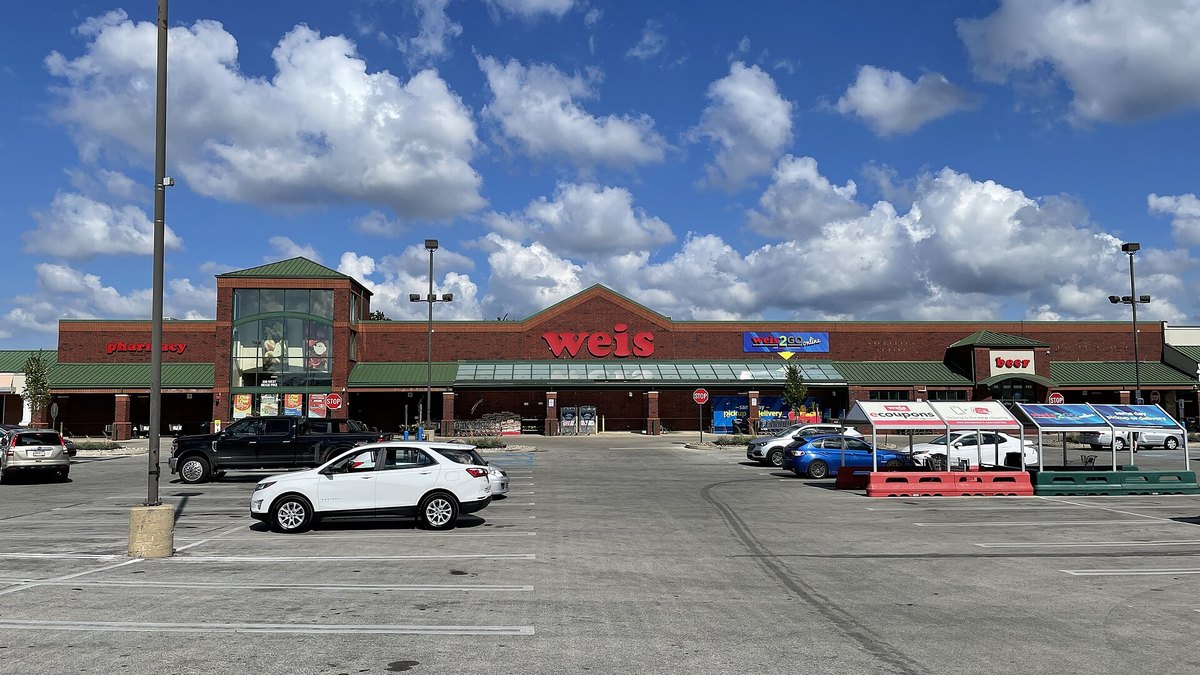
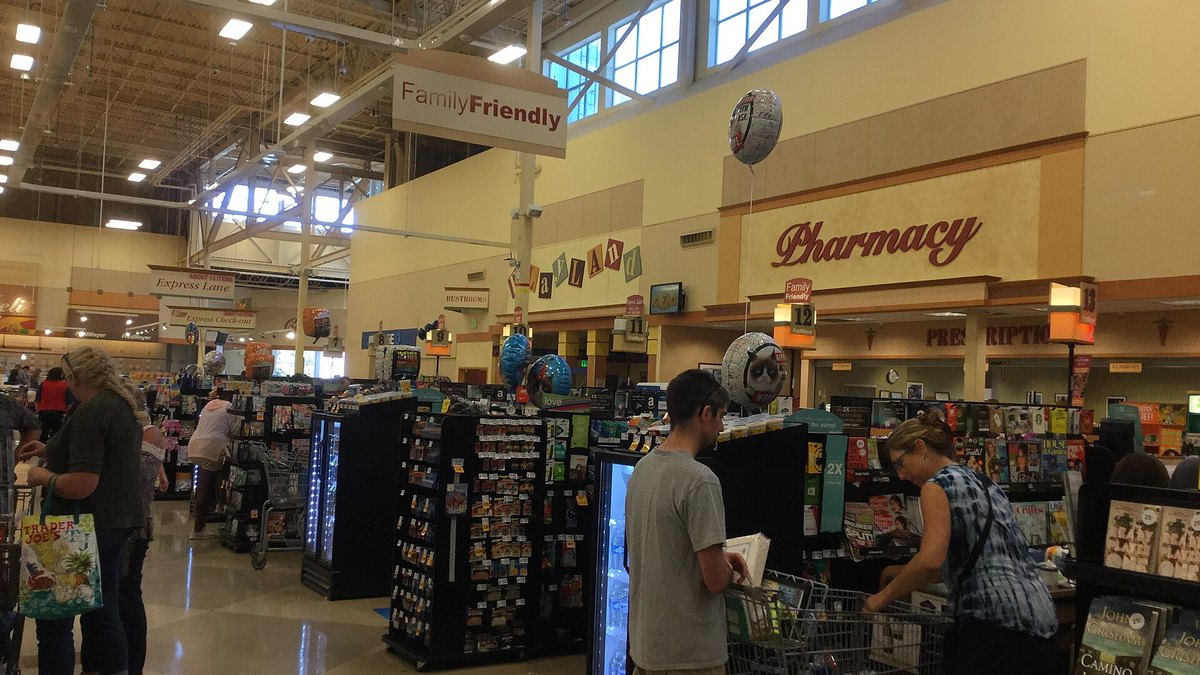
Grocery Comparable Store Sales Growth
Photo: Dough4872 / CC BY-SA 4.0 via Wikimedia Commons
Answrs VerdictThe headline grocery sales KPI.
Formula: Year-over-year change in sales for stores open long enough to compare (Kroger calls it identical sales)Kroger: Identical sales without fuel and Adjusted Items up 2.9% in fiscal 2025 (year ended January 31, 2026), driven by eCommerce, Pharmacy and FreshAlbertsons: Identical sales without fuel up 2.0% in fiscal 2025 (year ended February 28, 2026)Sprouts: Comparable store sales up 7.3% in fiscal 2025 (7.6% in fiscal 2024)Weis Markets: Comparable store sales without fuel up 2.1% in 2025, versus 1.9% in 2024
Comparable store sales growth is the year-over-year change in sales for stores open long enough to compare. Kroger reported identical sales without fuel up 2.9% in fiscal 2025, Albertsons 2.0%, Sprouts 7.3% and Weis Markets 2.1%.
Go ifEvery grocer open more than a year; it strips out the effect of new stores
Skip ifYou opened in the last year and have no prior-year base
Why #1 over #2: It combines traffic and basket in one number and ignores new openings, which sales per square foot does not.
2
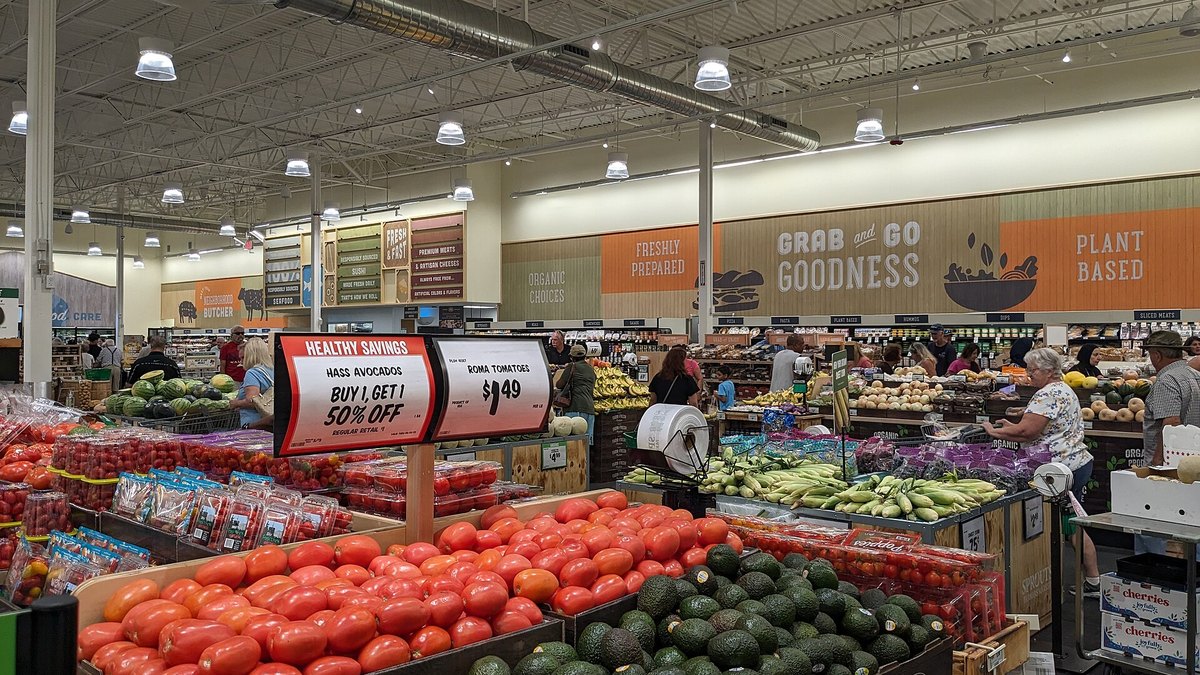
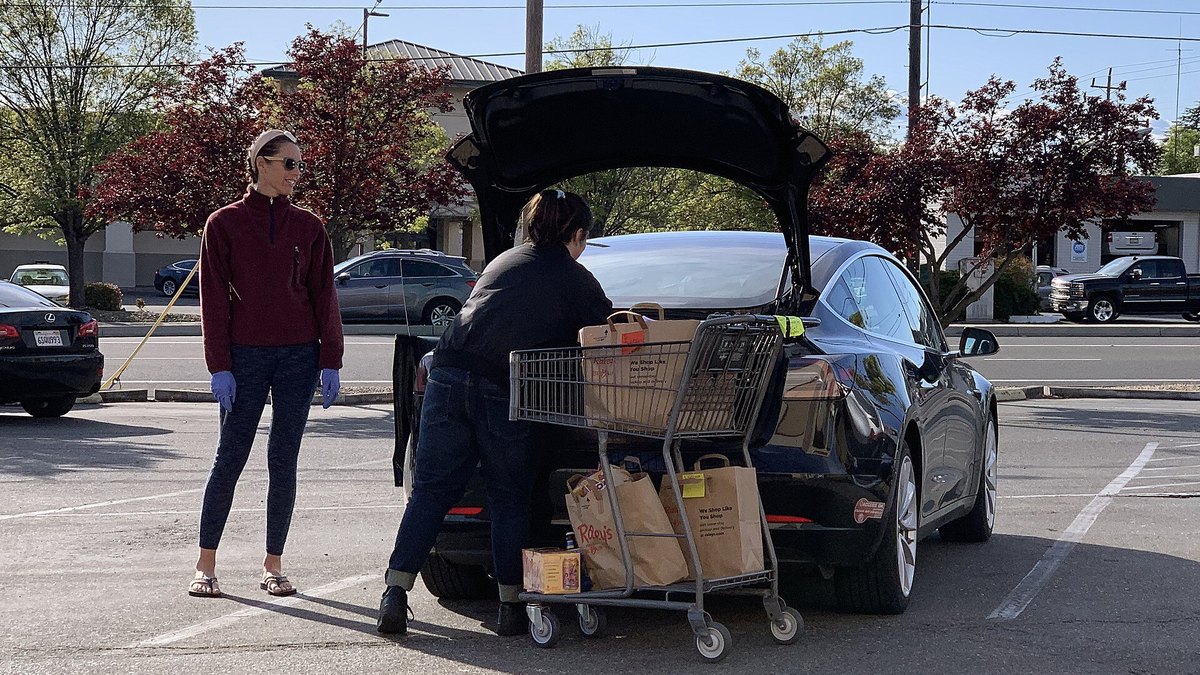
Grocery Gross Margin Percentage
Photo: Pokemonprime / CC BY 4.0 via Wikimedia Commons
Answrs VerdictThe sales-margin KPI.
Formula: Sales minus cost of sales, divided by salesKroger: Gross margin rate 22.9% in 2025, versus 22.3% in 2024Weis Markets: Gross profit margin 25.1% in 2025 and 25.1% in 2024Albertsons: Gross margin rate 27.2% in fiscal 2025, versus 27.7% in fiscal 2024Sprouts: Gross margin 38.8% in fiscal 2025, versus 38.1% in fiscal 2024
Gross margin is sales minus cost of sales, divided by sales. Kroger reported 22.9% in 2025, Weis Markets 25.1%, Albertsons 27.2% and Sprouts 38.8%, so compare a grocer only with a similar mix of fuel, pharmacy and fresh.
Go ifOwners pricing the center store, fresh and pharmacy mix
Skip ifYou cannot separate fuel and pharmacy sales, which carry lower margins
Why #2 over #3: It shows what each sales dollar keeps, which the growth KPIs above cannot.
3
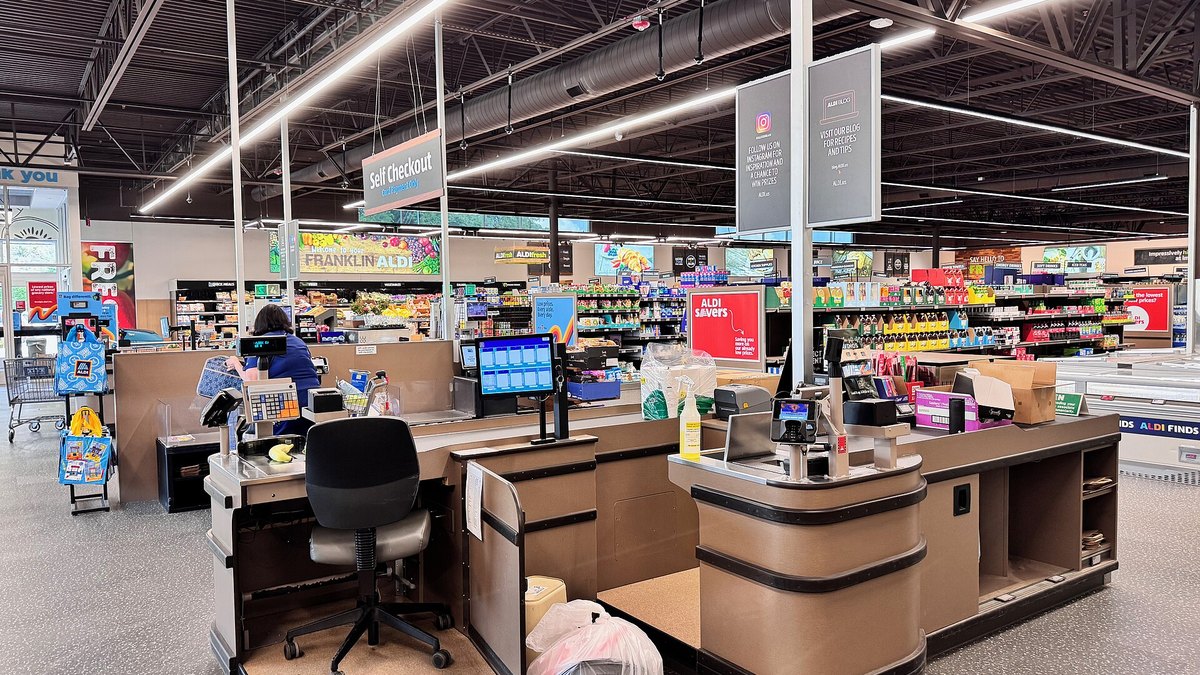
Grocery Average Basket Size
Photo: Harrison Keely / CC BY 4.0 via Wikimedia Commons
Answrs VerdictThe ticket-size KPI.
Formula: Sales divided by customer transactionsFMI benchmark: Sales per customer transaction in 2025: $49.06 in store and $106 onlineKroger: No benchmark published in the sources citedAlbertsons: No benchmark published in the sources cited
Average basket size is sales per customer transaction. FMI reported $49.06 in store and $106 online in 2025; the Kroger and Albertsons filings cited publish no basket figure.
Go ifGrocers working on promotions, bundles and delivery minimums
Skip ifYou have no transaction counts to divide into sales
Why #3 over #4: It shows what shoppers buy per trip, which customer count cannot.
4
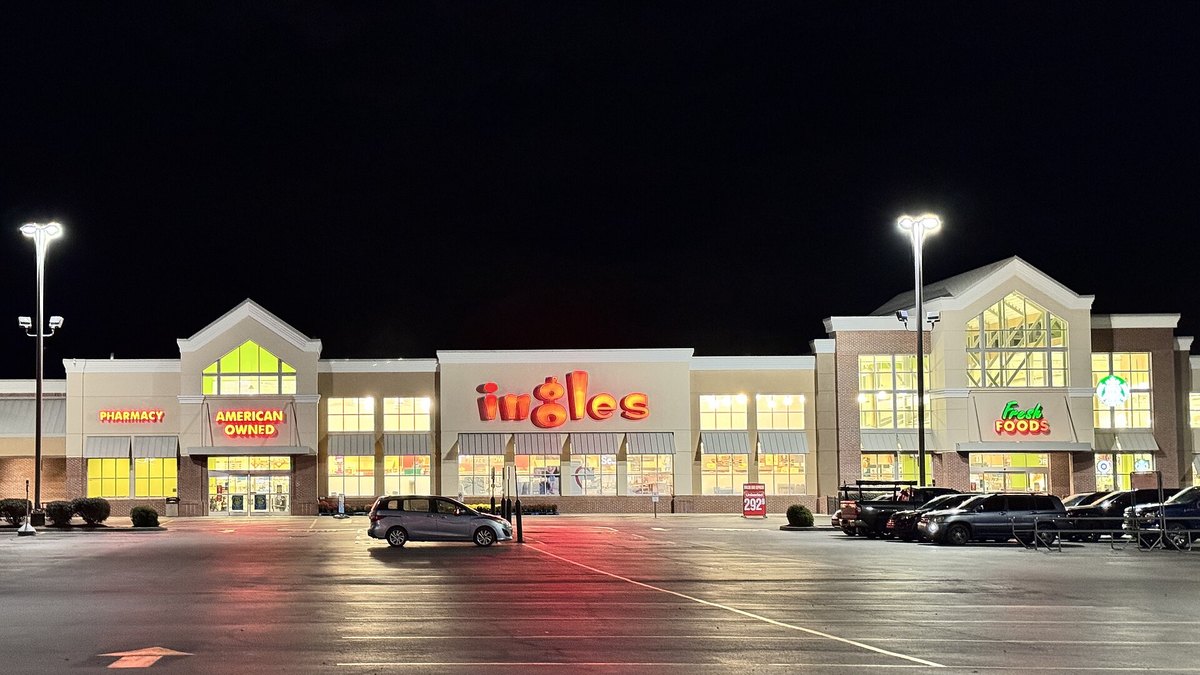
Grocery Sales per Square Foot
Photo: Harrison Keely / CC BY 4.0 via Wikimedia Commons
Answrs VerdictThe space-productivity KPI.
Formula: Sales divided by selling square feetFMI benchmark: Weekly sales per square foot of selling area $19.59 in 2025, with average weekly sales per supermarket of $668,377Ingles Markets: Weighted average sales per square foot of selling space $656 in fiscal 2025, versus $676 in fiscal 2024Store size: FMI puts the average supermarket at 42,272 square feet in 2025; Sprouts averaged 27,237 square feet per store at year-end 2025
Sales per square foot is sales divided by selling space. FMI reported $19.59 per week per square foot of selling area in 2025, and Ingles Markets reported $656 per square foot of selling space for fiscal 2025.
Go ifOperators comparing stores of different sizes or planning a remodel
Skip ifSelling space is not measured separately from the backroom
Why #4 over #5: It compares stores of different sizes, which total comparable sales do not.
5
Grocery Customer Count and Loyalty Share
Photo: Northwest Retail / CC BY-SA 2.0 via Wikimedia Commons
Answrs VerdictThe traffic KPI.
Formula: Transactions or households served, tracked year over year and through the loyalty programAlbertsons: Loyalty members up 12% to 51.2 million in fiscal 2025Kroger: Serves approximately 63 million households annually; over 95% of customer transactions are tethered to a Kroger loyalty cardIndependent grocers: No benchmark published in the sources cited
Customer count and loyalty share track how many households shop you. Albertsons reported loyalty members up 12% to 51.2 million in fiscal 2025, and Kroger reported over 95% of customer transactions tied to a loyalty card.
Go ifGrocers who want to know whether more households are shopping, not just spending more
Skip ifYou cannot tie purchases to a card or phone number
Why #5 over #6: It shows whether growth comes from more households or bigger baskets.
6
Grocery E-Commerce Sales Share
Photo: Robert Couse-Baker / CC BY 2.0 via Wikimedia Commons
Answrs VerdictThe omnichannel KPI.
Formula: Online and delivery sales divided by total salesFMI benchmark: 8.9% of grocery item sales were online in 2025Kroger: eCommerce sales up 16% in 2025, led by Delivery solutionsAlbertsons: Digital sales, including Drive Up & Go curbside pickup and delivery, up 21% in fiscal 2025
E-commerce sales share is online and delivery sales divided by total sales. FMI reported 8.9% of grocery item sales online in 2025; Kroger reported eCommerce sales up 16% and Albertsons digital sales up 21%.
Go ifGrocers running curbside pickup or delivery
Skip ifYou sell only in store with no online ordering
Why #6 over #7: It tracks the channel with the fastest reported growth, which in-store KPIs miss.
7
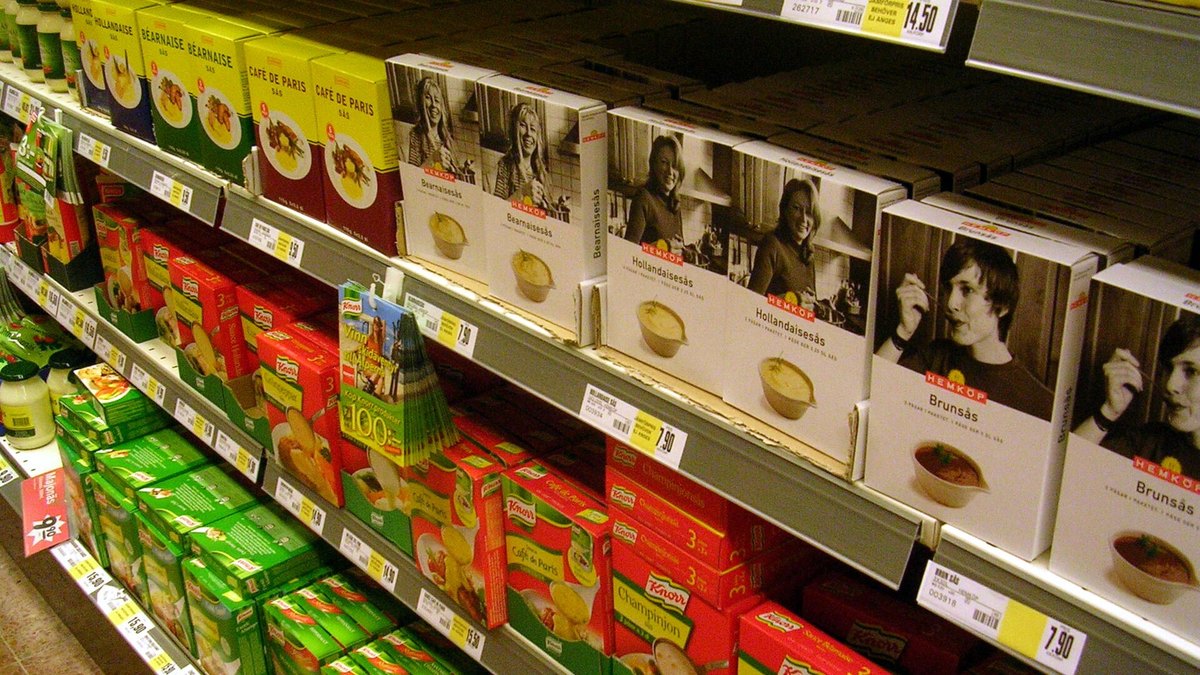
Grocery Private-Label Penetration
Photo: Väsk / CC BY-SA 3.0 via Wikimedia Commons
Answrs VerdictThe brand-mix KPI.
Formula: Store-brand sales divided by total salesPLMA benchmark: Store brands held a record 21.3% dollar share and 23.5% unit share in 2025, across all U.S. outletsSprouts: Sprouts Brand products represented just over 25% of revenue in fiscal 2025Kroger: Our Brands represented over $39 billion of sales in 2025Albertsons: Own Brands retail sales of $16.9 billion in fiscal 2025
Private-label penetration is store-brand sales divided by total sales. PLMA reported a record 21.3% dollar share across all outlets in 2025, and Sprouts reported its brand at just over 25% of revenue.
Go ifGrocers chasing margin and loyalty through exclusive products
Skip ifYour store carries only national brands
Why #7 over #8: It shows brand mix, which feeds margin and loyalty but not traffic.
8
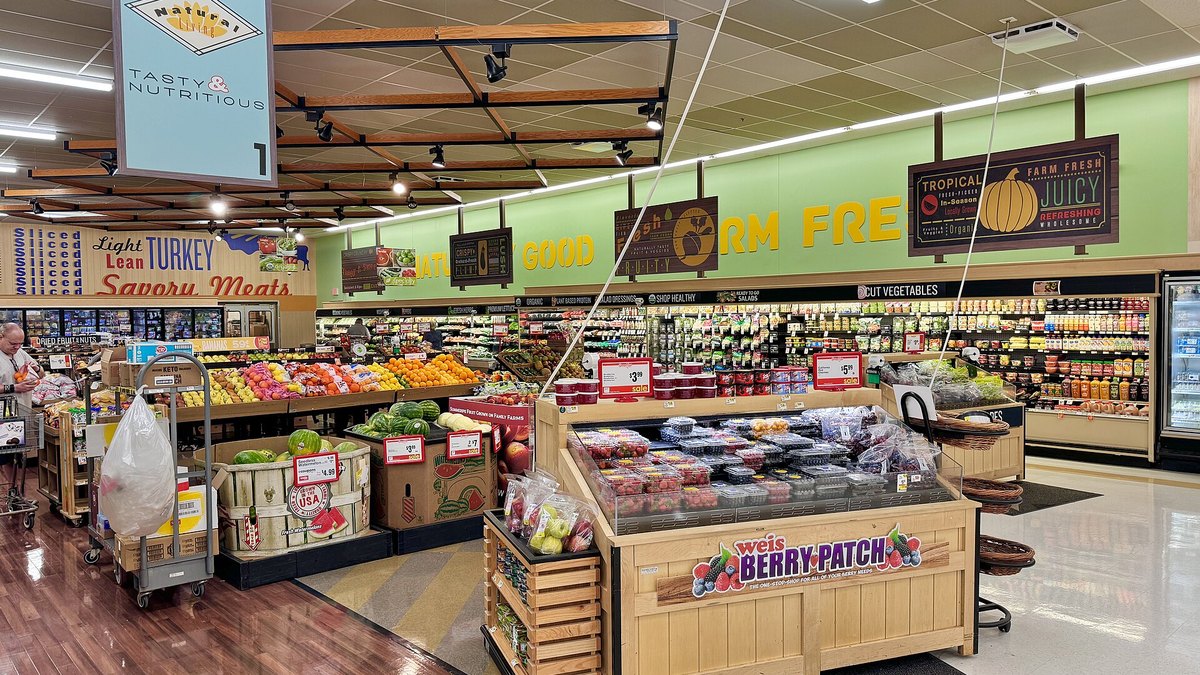
Grocery Fresh Department Sales Mix
Photo: Harrison Keely / CC BY 4.0 via Wikimedia Commons
Answrs VerdictThe category-mix KPI.
Formula: Fresh department sales divided by total salesWeis Markets: Fresh (meats, seafood, produce, floral, deli, prepared foods, bakery) was 28.7% of net sales in 2025, versus 28.6% in 2024Weis Markets mix: Center store 52.6%, pharmacy services 13.6% and fuel 5.0% of 2025 net salesOther grocers: No benchmark published in the sources cited
Fresh department sales mix is fresh sales divided by total sales. Weis Markets reported fresh at 28.7% of net sales in 2025, versus 28.6% in 2024; no other grocer in the sources cited gave a figure.
Go ifGrocers deciding where to put space, labor and promotions
Skip ifYour store has no service departments
Why #8 over #9: It shows where sales come from inside the store, which total sales hide.
9
Grocery Shrink Rate
Photo: Harrison Keely / CC BY 4.0 via Wikimedia Commons
Answrs VerdictThe margin-leak KPI.
Formula: Inventory lost to waste, damage, theft and errors, divided by salesSprouts: Gross margin rose 0.7 points to 38.8% in fiscal 2025, a result of improved shrink and inventory managementKroger: Gross margin rate rose to 22.9% in 2025, helped by lower shrinkPublished rate: No shrink percentage published in the filings or FMI pages cited
Shrink rate is inventory lost to waste, damage, theft and errors, divided by sales. No shrink percentage was found in the sources cited, though Sprouts credited improved shrink for part of its 38.8% gross margin in fiscal 2025.
Go ifGrocers with heavy perishables, where waste hits margin first
Skip ifYou do not count inventory regularly, which makes the rate meaningless
Why #9 over #10: It is a cost KPI more than a sales KPI, so it ranks below the sales measures.
10
Grocery Inventory Turnover
Photo: Virginia Retail from Virginia, USA / CC BY 2.0 via Wikimedia Commons
Answrs VerdictThe stock-productivity KPI.
Formula: Cost of goods sold divided by average inventory at costUse: Kroger recognizes some vendor allowances in line with inventory turns, so turns affect reported costBenchmark: No grocery turnover figure published by FMI or in the SEC filings citedVendor guide: Cleverence gives only a rule of thumb for grocery and says to compute turns from your own COGS and inventory
Inventory turnover is cost of goods sold divided by average inventory. No published grocery benchmark was found in FMI data or the SEC filings cited.
Go ifOperators managing perishables, ordering and cash tied up in stock
Skip ifYou need a published industry benchmark, because none was found
How we ranked these
We ranked sales KPIs on how directly they show grocery revenue health and how clearly published sources define them, using the latest annual reports of Kroger, Albertsons, Sprouts, Weis Markets and Ingles Markets, FMI food industry facts and the PLMA store-brand release. We cite a benchmark only where a source states one. Fiscal years differ by company, chain figures are not independent-grocer averages, and the inventory-turnover formula comes from a vendor guide. Facts are taken from each maker's own published information; check the official site before you buy.
Questions people ask
What is the most important sales KPI in grocery?
Comparable (identical) store sales growth is the headline KPI. Kroger reported identical sales without fuel up 2.9% in fiscal 2025, Albertsons 2.0%, and Sprouts comparable store sales up 7.3%.
What is a good gross margin for a grocery store?
It varies by format. Kroger reported 22.9% in 2025, Weis Markets 25.1%, Albertsons 27.2% and Sprouts 38.8%.
What is the average grocery basket size?
FMI reported sales per customer transaction of $49.06 in store and $106 online in 2025.
What are average weekly sales per square foot at a supermarket?
FMI reported $19.59 per week per square foot of selling area in 2025. Ingles Markets reported $656 per square foot of selling space for fiscal 2025.
Gross margin, % of sales at a glance
Kroger 202422.3 %
Kroger 202522.9 %
Weis Markets 202525.1 %
Albertsons fiscal 202527.2 %
Albertsons fiscal 202427.7 %
Sprouts fiscal 202438.1 %
Sprouts fiscal 202538.8 %
Gross margin, % of sales, as published by each maker. Picks without a published figure are left off.