Revenue per skier visit is the top ski resort revenue KPI in 2027, followed by effective ticket price and season pass share. Vail Resorts reported ETP of $94.85 for fiscal 2026 and pass products at approximately 70% of lift revenue, while Compagnie des Alpes grew average sales per skier-day 3.5%. NSAA estimated 52.6 million U.S. skier visits in 2025/26 as snowfall ran 33 percent below average; snowmaking cost, labor percent and weather elasticity have no public benchmark, and this page says so.
Definition: Revenue divided by skier visits (skier-days); Compagnie des Alpes tracks it as average sales per skier-dayCompagnie des Alpes: Average sales per skier-day up 3.5% in 2025/26, driving ski lift sales up 4.4% on a comparable basisVail Resorts inputs: Total Mountain net revenue $2,503,184 thousand on 15,299 thousand total skier visits in fiscal 2026 (ended July 31, 2026)Vail Resorts prior year: Total Mountain net revenue $2,629,873 thousand on 17,665 thousand total skier visits in fiscal 2025Vail Resorts Resort Reported EBITDA: $745.7 million for fiscal 2026, versus $844.1 million the prior year
Revenue per skier visit puts every revenue line on one denominator. Compagnie des Alpes grew average sales per skier-day 3.5% in 2025/26. Vail Resorts reported Mountain net revenue of $2,503,184 thousand on 15,299 thousand skier visits for fiscal 2026.
Go ifComparing resorts of different size on how much each visit earns across lift, lessons, food and retail
Skip ifYou need a published dollar benchmark; neither company publishes the per-visit dollar figure itself
Why #1 over #2: It captures lift, lessons, food and retail together, which ETP covers only for the lift.
2
Ski Resort Effective Ticket Price (ETP)
Photo: Jared C. Benedict / CC BY-SA 3.0 via Wikimedia Commons
Answrs VerdictThe lift-yield KPI.
Definition: Vail Resorts: ETP is calculated as lift revenue divided by total skier visits for each periodVail Resorts fiscal 2026: ETP $94.85, up 11.5% from $85.09 in fiscal 2025Vail Resorts fiscal 2024: ETP $82.14Paid ETP: Paid ETP decreased 8.8% in fiscal 2026 on a shift of visits to lower-ETP eastern U.S. resorts and new ticket discounts
Vail Resorts calculates ETP as lift revenue divided by total skier visits. It reached $94.85 in fiscal 2026, up 11.5% from $85.09, while paid ETP fell 8.8% as visits shifted east and new discounts took hold.
Go ifTracking lift pricing power net of passes, discounts and visit mix
Skip ifYou compare it across operators; only Vail Resorts publishes ETP under this definition
Why #2 over #3: It is the one published lift-yield figure, which pass share does not give.
3
Ski Season Pass Share of Lift Revenue and Visits
Photo: Flickr user: Brendan Gray London, UK https://www.flickr.com/photos/grayskull/ / CC BY-SA 2.0 via Wikimedia Commons
Answrs VerdictThe revenue-stability KPI.
Definition: The share of lift revenue and visits that come from season pass products rather than daily ticketsVail Resorts: Pass products generated approximately 70% of total lift revenue and approximately 73% of total visitation in fiscal 2026, versus 65% of lift revenue in fiscal 2025NSAA (U.S. industry): Season passes were 49 percent of U.S. visits in 2025/26; daily and multi-day tickets were 31 percentVail Resorts 2026/27 pass sales: Pass units sold through September 18, 2026 down approximately 12% and sales dollars down approximately 6% from the prior year periodPass revenue: Pass product revenue rose $38.8 million in fiscal 2026
Pass products generated approximately 70% of Vail Resorts lift revenue and approximately 73% of visitation in fiscal 2026. NSAA says season passes were 49 percent of U.S. visits. Vail Resorts pass units for 2026/27 were down approximately 12% through September 18, 2026.
Go ifMeasuring how much revenue is locked in before the snow falls
Skip ifYou run a small area with few pass holders; daily ticket yield matters more
Why #3 over #4: It shows how much revenue is secured before the season, which ancillary totals do not.
4
Ski Resort Ancillary Revenue (Ski School, Dining, Retail and Rental)
Photo: Scott Catron from Sandy, Utah, USA / CC BY-SA 2.0 via Wikimedia Commons
Answrs VerdictThe spend-per-guest KPI.
Definition: Non-lift mountain revenue: ski school, dining, retail and rental; Vail Resorts reports each line separatelySki school: $278,050 thousand in fiscal 2026, down 10.3%Dining: $222,518 thousand in fiscal 2026, down 7.6%Retail and rental: $282,774 thousand in fiscal 2026, down 6.5%Pass holder discount: Epic Mountain Rewards gives pass holders 20% off on-mountain food and beverage, lodging, group ski school lessons and equipment rentals
Vail Resorts reported ski school revenue of $278,050 thousand, dining $222,518 thousand and retail and rental $282,774 thousand for fiscal 2026, each down on fewer visits. Pass holders get 20% off through Epic Mountain Rewards.
Go ifSeeing how much each visit spends beyond the lift ticket
Skip ifYou want a per-visit figure; the filing gives totals by line
Why #4 over #5: It measures spend beyond the ticket, which a visit count cannot.
5
Ski Resort Skier Visits
Photo: Joe Lin from New York, NY, USA / CC BY 2.0 via Wikimedia Commons
Answrs VerdictThe volume KPI.
Definition: The count of snowsports visits at ski areas in a season, the volume measure NSAA reports for U.S. ski areasU.S. total (NSAA): An estimated 52.6 million visits in 2025/26, 9 million fewer than the prior season; ranked 32nd of 48 seasonsU.S. regions (NSAA): Rocky Mountain 20.1 million, Northeast 12.9 million, Midwest 5.8 million, Pacific Southwest 5.7 million, Southeast 4.8 million, Pacific Northwest 3.2 millionVail Resorts: 13.1 million North American skier visits in 2025/26, approximately 17.9% of about 72.9 million North American visitsCompagnie des Alpes (France): 14.2 million skier-days in 2025/26, 25% of the 56.1 million skier-days sold in France
NSAA estimated 52.6 million U.S. visits in 2025/26, ranked 32nd of 48 seasons. Vail Resorts had 13.1 million North American visits, approximately 17.9% of the total, and Compagnie des Alpes sold 14.2 million skier-days in France.
Go ifSizing demand and market share before judging price or spend
Skip ifYou want revenue; visits alone ignore price and mix
Why #5 over #6: It is the most widely published ski metric, which lodging RevPAR is not.
6
Ski Resort Lodging RevPAR and ADR
Photo: Ahodges7 / CC BY-SA 3.0 via Wikimedia Commons
Answrs VerdictThe lodging KPI.
Definition: Revenue per available room (RevPAR) and average daily rate (ADR) for resort hotels and managed condominiumsVail Resorts owned hotels: ADR $324.58, paid occupancy 52.1% and RevPAR $169.04 in fiscal 2026Industry comparison: Upper upscale segment ADR $232.83, paid occupancy 68.7% and RevPAR $159.94, as cited by Vail ResortsManaged condominiums: ADR $393.60 and RevPAR $105.39 in fiscal 2026, versus RevPAR $116.70SkiStar bookings: Overnight stays booked through SkiStar for winter 2026/27 up 3 percent at the September 30, 2026 report
Vail Resorts owned hotels earned ADR of $324.58 and RevPAR of $169.04 at 52.1% paid occupancy in fiscal 2026, against $159.94 RevPAR for the upper upscale segment. SkiStar overnight bookings for winter 2026/27 were up 3 percent.
Go ifResorts that own or manage beds at the base area
Skip ifYou run a day-ski area with no lodging
Why #6 over #7: It covers base-area beds, a revenue line paid lift tickets miss.
7
Ski Resort Paid Lift Ticket Revenue and Pricing Mix
Photo: Jeff Gunn from Atlanta, USA / CC BY 2.0 via Wikimedia Commons
Answrs VerdictThe ticket-pricing KPI.
Definition: Lift revenue from daily and multi-day tickets, split from pass revenue; Vail Resorts reports lift revenue as pass revenue plus paid lift revenueVail Resorts lift revenue: $1,451,068 thousand in fiscal 2026, down 3.5%; lift revenue was approximately 58% of Mountain net revenuePaid lift revenue: Down 17.5% in fiscal 2026 on lower visitation from record low snowfall in the western U.S.Pricing mix: New Epic Friends discount and a super advance lift ticket discount for buying approximately one month aheadCompagnie des Alpes: Ski lifts are approximately 95% of its ski division sales; ski division sales €632.8 million in 2025/26, up 6.5%
Vail Resorts lift revenue was $1,451,068 thousand in fiscal 2026, down 3.5%, as paid lift revenue fell 17.5%. It added an Epic Friends discount and a super advance ticket discount. Ski lifts are approximately 95% of Compagnie des Alpes ski division sales.
Go ifJudging how discounts and advance-purchase pricing change ticket revenue
Skip ifYou need a dynamic-pricing efficiency score; no operator publishes one
Why #7 over #8: It isolates the weather-exposed ticket revenue that capital reinvestment protects.
8
Ski Resort Capital and Snowmaking Reinvestment per Skier Visit
Photo: Coldstreamer20 / CC BY-SA 4.0 via Wikimedia Commons
Answrs VerdictThe reinvestment KPI.
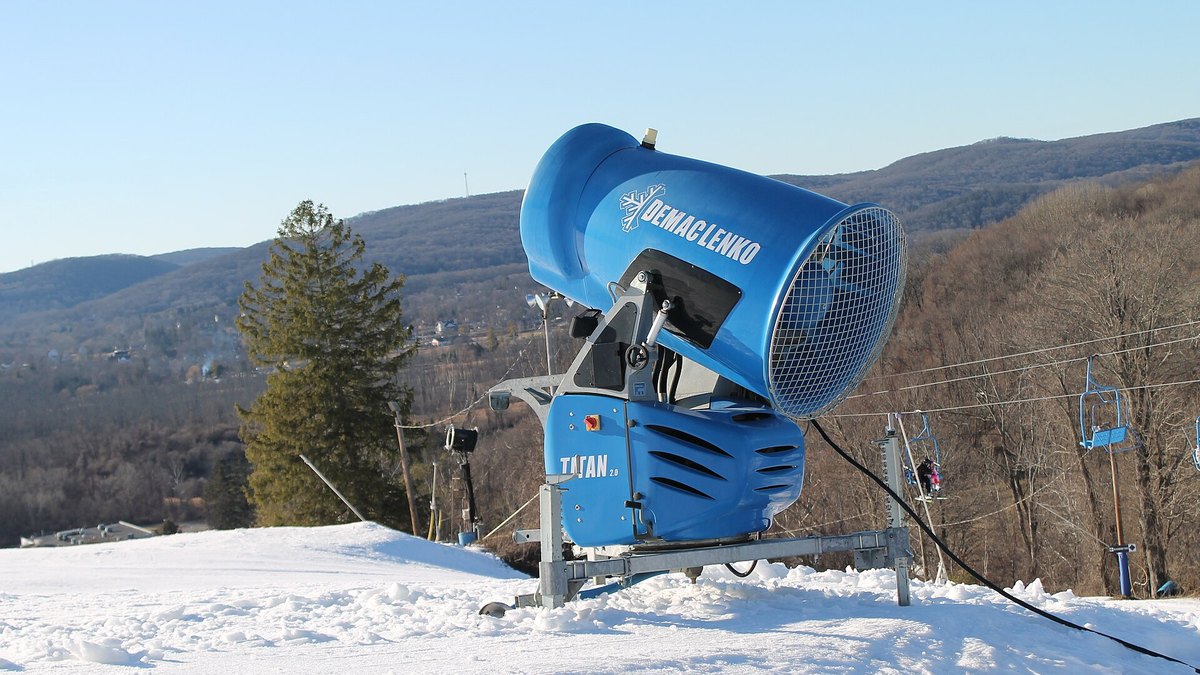
Definition: Capital spending divided by skier visits; NSAA reports reinvestment per skier visit for U.S. ski areasNSAA 2025/26: Reinvestment of $22.24 per skier visit, with capital expenditures of $569.3 millionNSAA lifts: 45 new and 52 upgraded liftsVail Resorts snowmaking: Over $105 million invested in improved snowmaking across its network since calendar year 2016Snowmaking cost per acre-foot: Not published by NSAA or Vail Resorts
NSAA reports reinvestment of $22.24 per skier visit and capital expenditures of $569.3 million, including 45 new and 52 upgraded lifts. Vail Resorts has invested over $105 million in snowmaking since 2016. No public source gives snowmaking cost per acre-foot.
Go ifChecking whether a resort reinvests enough to protect snow reliability and lift capacity
Skip ifYou want snowmaking cost per acre-foot; no public source reviewed gives it
Why #8 over #9: It is published industry-wide, unlike a labor-cost ratio.
9
Ski Resort Labor Cost and Mountain EBITDA
Photo: DimiTalen / CC0 via Wikimedia Commons
Answrs VerdictThe cost-control KPI.
Definition: Labor and benefit cost set against mountain revenue, and the EBITDA left after operating costsVail Resorts Mountain labor: Labor and labor-related benefits $736,375 thousand in fiscal 2026, down 3.2% from $760,955 thousand on reduced labor hoursVail Resorts Mountain Reported EBITDA: $729,352 thousand in fiscal 2026, down 11.2%Vail Resorts Lodging labor: $134,431 thousand in fiscal 2026, down 2.6%SkiStar: Operating profit SEK 872 million on net sales of SEK 4,954 million for September 2025 to August 2026Published ratio: Not published: Vail Resorts reports labor dollars, not labor as a percent of revenue
Vail Resorts Mountain labor was $736,375 thousand in fiscal 2026, down 3.2%, and Mountain Reported EBITDA was $729,352 thousand, down 11.2%. SkiStar earned operating profit of SEK 872 million on net sales of SEK 4,954 million.
Go ifWatching the biggest controllable cost against the revenue it supports
Skip ifYou need a peer labor-percent benchmark; none was found in public filings
Why #9 over #10: Its inputs are published, which a weather elasticity figure is not.
10
Ski Resort Snowfall Sensitivity of Revenue
Photo: DimiTalen / CC0 via Wikimedia Commons
Answrs VerdictThe weather-risk KPI.
Definition: How much visits and revenue move with snowfall; compare season results with snowfall against averageNSAA snowfall: Average national snowfall 112 inches in 2025/26 versus a 10-year average of 169 inches, 33 percent below averageNSAA visits: Visits 9.1 percent below the 10-year averageVail Resorts: Record low snowfall and historically warm temperatures across the western U.S. drove paid lift revenue down 17.5% and Mountain Reported EBITDA down 11.2%Pass hedge: Vail Resorts says its pass program mitigates exposure to more weather sensitive guestsPublished elasticity: Not published: no source reviewed gives a weather-adjusted demand elasticity figure
NSAA put 2025/26 snowfall at 112 inches against a 169-inch 10-year average, and visits 9.1 percent below average. Vail Resorts tied paid lift revenue down 17.5% to record low western snowfall and says passes reduce weather exposure.
Go ifStress-testing budgets for a low-snow season
Skip ifYou want a single elasticity coefficient; none is published
How we ranked these
We ranked ten ski resort revenue KPIs by how directly each measures revenue and how many public ski operators or industry bodies publish a figure for it. Benchmarks come from the Vail Resorts annual report on Form 10-K for the fiscal year ended July 31, 2026 and its fiscal 2026 results release, the Compagnie des Alpes 2025/26 full-year sales release of October 27, 2026, the SkiStar year-end report of September 30, 2026, and the National Ski Areas Association preliminary 2025/26 season data released May 5, 2026, which is still subject to revision. Fiscal years differ, so compare each operator with its own history first. Where a KPI has no public benchmark, such as snowmaking cost per acre-foot, labor as a percent of revenue and weather elasticity, we say so instead of estimating one. Hotel-wide RevPAR benchmarks are on our hotel industry sales KPIs page. Facts are taken from each maker's own published information; check the official site before you buy.
Questions people ask
What is the most important revenue KPI for a ski resort?
Revenue per skier visit, because it combines lift, lessons, dining and retail. Compagnie des Alpes reported average sales per skier-day up 3.5% in 2025/26.
What is effective ticket price (ETP)?
Vail Resorts calculates ETP as lift revenue divided by total skier visits. It reported ETP of $94.85 for fiscal 2026, up 11.5% from $85.09.
How many skier visits did U.S. ski areas have in 2025/26?
NSAA estimated 52.6 million visits, 9 million fewer than the prior season, with the Rocky Mountain region leading at 20.1 million.
How much ski resort revenue comes from season passes?
At Vail Resorts, pass products generated approximately 70% of fiscal 2026 lift revenue. Nationally, NSAA says season passes were 49 percent of 2025/26 visits.
U.S. skier visits by region, 2025/26 season (NSAA preliminary) at a glance
Pacific Northwest3.2 million visits
Southeast4.8 million visits
Pacific Southwest5.7 million visits
Midwest5.8 million visits
Northeast12.9 million visits
Rocky Mountain20.1 million visits
U.S. skier visits by region, 2025/26 season (NSAA preliminary), as published by each maker. Picks without a published figure are left off.