What are the most important KPIs every property management company should track in 2027?
The KPIs a property management company should track in 2027 are occupancy and vacancy, rent change on new and renewal leases, net operating income with revenue and expenses, resident retention and turnover, collections and bad debt, maintenance and make-ready performance, and the cost and capacity of its own team. Public benchmarks exist for the first five from Census data and from the same-store results of listed apartment and single-family rental owners, but not for maintenance response time or staff productivity, which this page explains how to measure instead. The Census Bureau put the U.S. rental vacancy rate at 7.6 percent in the third quarter of 2026, up from 7.1 percent a year earlier and 7.3 percent in the second quarter. Equity Residential reported same store physical occupancy of 96.2 percent in the second quarter of 2026 versus 96.6 percent a year earlier, and Invitation Homes reported 96.4 percent for the third quarter versus 96.5 percent. Those owners are not property management companies and their portfolios are not average, so treat them as reference points for the same measures, not as targets. Every source was read on November 8, 2026. This page is not financial advice.
Occupancy and vacancy
Occupancy is the first KPI because every other revenue measure sits on top of it. Track physical occupancy (units occupied) and economic occupancy (rent collected against potential rent), by property and by unit type, along with the days a unit sits empty between residents.
- U.S. rental vacancy rate, third quarter 2026 (Census Bureau, released October 28, 2026)7.6 percent, versus 7.1 percent in the third quarter of 2025 and 7.3 percent in the second quarter of 2026; the homeowner vacancy rate was 1.2 percent.
- Equity Residential same store physical occupancy, second quarter 2026 (company-reported)96.2 percent versus 96.6 percent a year earlier, across 78,612 apartment units.
- AvalonBay Same Store economic occupancy, second quarter 2026 (company-reported)96.1 percent.
- Invitation Homes Same Store average occupancy, third quarter 2026 (company-reported)96.4%, a reduction of 10 basis points year over year, from 96.5%.
- American Homes 4 Rent Same-Home Average Occupied Days Percentage, third quarter 2026 (company-reported)96.0%, a 30 basis point decrease.
The Census rate covers all rental housing, including units that are not professionally managed, so it will not match a managed portfolio. Note also that the owners define occupancy differently: Equity Residential reports physical occupancy, AvalonBay economic occupancy, and American Homes 4 Rent the share of days a home is occupied. Pick one definition, apply it to every property, and compare each building with its own history and with the Census figure for its market.
Rent change on new and renewal leases
Average rent can hide what is happening at the lease level. The KPI is the change in rent when a unit is re-leased to a new resident and when an existing resident renews, shown separately and blended. A widening gap between the two is an early sign of pricing pressure.
- Equity Residential, second quarter 2026 (company-reported)Renewal rate achieved 5.2 percent versus 5.1 percent; new lease change (0.7%) versus (0.6%).
- Invitation Homes, third quarter 2026 (company-reported)Renewal rent growth 4.3% (4.5% a year earlier); new lease rent growth (0.2)% ((0.7)% a year earlier); blended 3.0% (2.9%).
- American Homes 4 Rent, third quarter 2026 (company-reported)2.6% blended rate growth, with lease spreads of 3.3% and 1.0% on renewals and new leases.
- NMHC Market Tightness Index, July 2026 survey (released July 23, 2026)57, above the breakeven level of 50, indicating higher rent growth and lower vacancies; rents continued to decrease in many high-supply sunbelt markets.
The pattern in the three reports is the same: renewals are priced above new leases. NMHC's executive survey is a sentiment index and not a rent measure, but its note that rents were still falling in many high-supply sunbelt markets is a reminder that a national figure will not describe any single property. Track both lease types for each building against the local market.
Net operating income, revenue and expenses
Owners judge a manager by net operating income, so the management company should report revenue growth, expense growth and NOI growth for the same properties across periods (same-store), which removes the effect of acquisitions and sales. Watching expenses alongside revenue matters because NOI can fall when revenue is rising.
- Equity Residential same store, second quarter 2026 versus second quarter 2025 (company-reported)Revenues 1.9 percent, expenses 3.0 percent, NOI 1.4 percent.
- AvalonBay Same Store Residential, second quarter 2026 (company-reported)Revenue up 1.6% to $709,586,000, operating expenses up 2.9% to $221,034,000, NOI up 1.0% to $488,552,000.
- Invitation Homes Same Store, third quarter 2026 (company-reported)Core revenues up 1.6%, controllable expenses up 4.9%, NOI up 1.1%.
- American Homes 4 Rent Same-Home, third quarter 2026 (company-reported)Core revenues up 2.3% to $371.1 million, core property operating expenses up 1.8% to $125.2 million, core NOI up 2.5% to $246.0 million.
In the apartment reports expenses grew faster than revenue, which held NOI growth below revenue growth. Operating expense per unit and the operating expense ratio (expenses as a share of revenue) are the natural companions to NOI. IREM publishes an Income/Expense IQ benchmarking summary of per-unit expenses, but its figures were not read for this page, so none are given.
Resident retention and turnover
Turnover is expensive: a unit that turns must be cleaned, repaired, marketed and re-leased, and it sits empty meanwhile. Track the share of expiring leases renewed (retention) and the share of units that turn over, by property and by lease month.
- Equity Residential retention, second quarter 2026 (company-reported)60.0 percent versus 59.3 percent a year earlier.
- AvalonBay Same Store turnover, second quarter 2026 (company-reported)42.6 percent versus 45.9 percent in the prior-year period.
- Invitation Homes turnover, third quarter 2026 (company-reported)6.2% versus 6.3%.
- American Homes 4 Rent Same-Home expenses, third quarter 2026 (company-reported)Core property operating expenses up 1.8%, primarily on higher repairs and maintenance (R&M) and turnover costs, net.
The turnover figures are quoted on different bases (AvalonBay and Invitation Homes publish different periods and conventions), so do not compare them with each other. Compare your own properties with themselves over time, and put the cost of a turn, including repairs and vacant days, next to the rate.
Collections, delinquency and bad debt
Rent that is billed but not collected never reaches NOI. Track the share of rent collected by a set day, delinquent balances by age, and bad debt written off as a share of gross rental revenue.
- Invitation Homes bad debt, third quarter 2026 (company-reported)0.8% of gross rental revenue versus 0.7%, a 10 basis point year over year increase.
Invitation Homes was the only owner among those read that stated bad debt in the release text used here, so no wider benchmark is given. For your own reporting, measure it the same way every month so that changes reflect residents, not definitions.
Maintenance, make-ready and resident service
The U.S. Bureau of Labor Statistics describes property managers as responsible for responding to repair requests, arranging repairs and contracting with vendors, which makes maintenance a core part of the job. It is also the area with the least public benchmarking.
- Work order response and completion time. Measure the time from request to first response and from request to completion, by priority (emergency versus routine).
- Repeat work orders. Share of requests reopened or repeated for the same unit and issue, a signal of fix quality.
- Make-ready time. Days from move-out to rent-ready, which feeds directly into vacant days.
- Resident satisfaction. A short survey after move-in, after a work order and at renewal.
The company itself: staff cost and capacity
A management company also runs a business: its own fees, payroll and the number of units each person looks after. Public labor data describe the size and pay of the workforce but not productivity.
- BLS QCEW, NAICS 531311 residential property managers, 2025 (government data, private sector, United States)79,466 establishments and 548,505 employment, with average annual pay of $66,787.
- BLS QCEW, NAICS 531311, 2024 (government data)77,238 establishments and 537,935 employment, with average annual pay of $63,884.
- BLS Occupational Outlook Handbook, property, real estate and community association managersMedian pay $69,990 per year in May 2025; 460,400 jobs in 2025; employment projected to grow 4 percent from 2025 to 2035.
The QCEW category counts firms that manage residential property for others and is a count of workplaces and jobs, not a measure of how well any one firm performs. The useful internal KPIs are units managed per property manager, units per maintenance technician, management fee revenue per unit, payroll as a share of fee revenue, and employee turnover. No source read for this page publishes a benchmark for any of them.
A scorecard to start with
A short monthly scorecard, reported by property and in total, covers the measures above.
- Occupancy. Physical and economic occupancy, vacant days between residents, and the local Census vacancy rate for context.
- Pricing. Rent change on new leases, on renewals and blended.
- Financials. Same-store revenue, expenses and NOI growth, plus operating expense per unit.
- Residents. Retention, turnover and cost per turn.
- Cash. Collections, delinquency by age and bad debt.
- Service. Work order response and completion, repeat work orders, make-ready days and resident satisfaction.
- Team. Units per manager and per technician, fee revenue per unit and staff turnover.
Define each KPI once in writing, calculate it the same way for every property, and report the change against the prior period and the same period a year earlier.
Questions people ask
What are the most important KPIs for a property management company?
Occupancy and vacancy, rent change on new and renewal leases, net operating income with revenue and expenses, retention and turnover, collections and bad debt, maintenance and make-ready performance, and team cost and capacity.
What is the current U.S. rental vacancy rate?
The Census Bureau reported 7.6 percent for the third quarter of 2026, versus 7.1 percent in the third quarter of 2025 and 7.3 percent in the second quarter of 2026.
What occupancy do large apartment and single-family rental owners report?
Equity Residential reported same store physical occupancy of 96.2 percent for the second quarter of 2026, AvalonBay economic occupancy of 96.1 percent, Invitation Homes 96.4% for the third quarter, and American Homes 4 Rent 96.0%. They define occupancy differently and are owners, not property management companies.
Is there a benchmark for maintenance response time?
None was found in the public sources read for this page. Measure request-to-response and request-to-completion time by priority from your own work order system.
How many people work in residential property management?
BLS QCEW data for NAICS 531311 show 548,505 employment across 79,466 establishments in 2025, with average annual pay of $66,787. The BLS Occupational Outlook Handbook counted 460,400 property, real estate and community association manager jobs in 2025.
Sources
- U.S. Census Bureau: Quarterly Residential Vacancies and Homeownership, third quarter 2026 · Rental and homeowner vacancy rates
- U.S. Bureau of Labor Statistics: Occupational Outlook Handbook, Property, Real Estate, and Community Association Managers · Pay, employment, outlook and duties
- U.S. Bureau of Labor Statistics: QCEW open data, NAICS 531311 · Establishments, employment and pay, 2024 and 2025
- Equity Residential: second quarter 2026 results, July 22, 2026 (SEC 8-K exhibit 99.1) · Same store revenue, expenses, NOI, occupancy, retention, rent change
- AvalonBay Communities: second quarter 2026 results, July 22, 2026 · Same Store Residential revenue, expenses, NOI, economic occupancy, turnover
- Invitation Homes: third quarter 2026 supplemental, October 28, 2026 (SEC 8-K) · Same Store occupancy, turnover, NOI, rent growth, expenses, bad debt
- American Homes 4 Rent: third quarter 2026 results, November 4, 2026 (SEC 8-K exhibit 99.1) · Same-Home NOI, revenue, occupancy, lease spreads, expense drivers
- National Multifamily Housing Council: July 2026 Quarterly Survey of Apartment Market Conditions, July 23, 2026 · Market Tightness Index
- IREM: Insights from the Income/Expense IQ National Summary · Existence of an expense benchmarking product (figures not read)
Figures were read from the linked pages on November 8, 2026. Company figures are company-reported same-store measures for owners of apartments and single-family rental homes, not property management companies, and the apartment results are for the second quarter of 2026 because the third quarter releases were not read for this page. Census and BLS figures are government statistics. Where no credible benchmark was found, the page says so instead of estimating. This page is not financial advice.
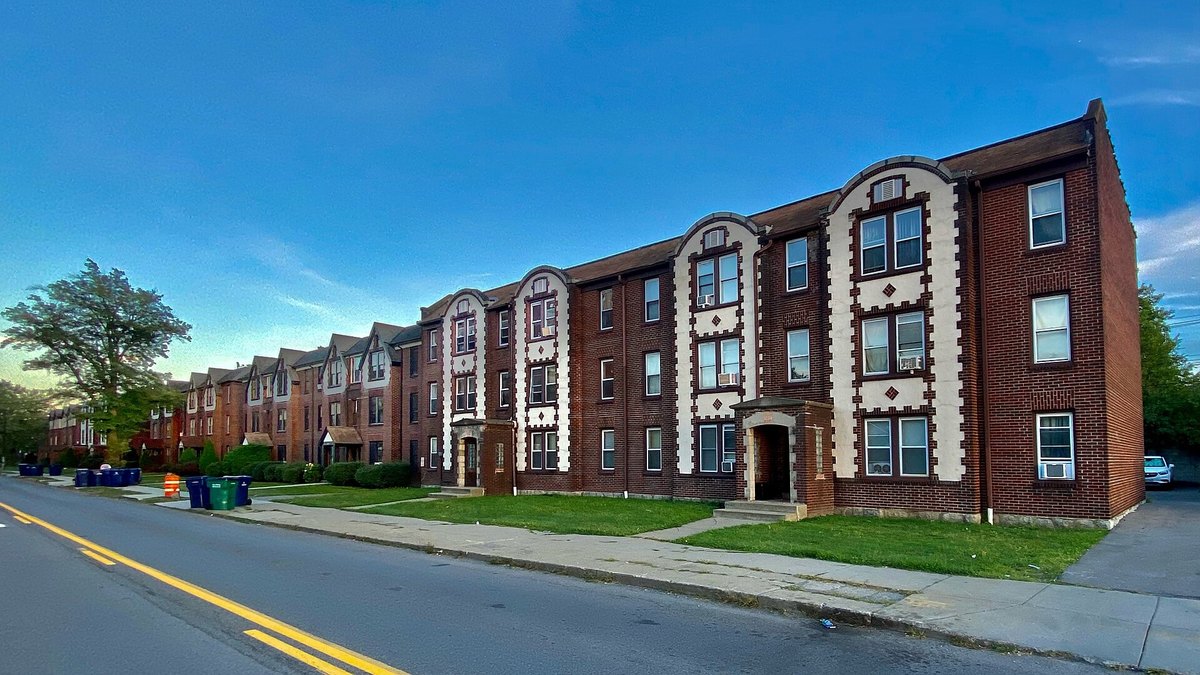
Top photo: Andre Carrotflower / CC BY-SA 4.0 via Wikimedia Commons