Sales KPIs for a Powersports Dealership in 2027
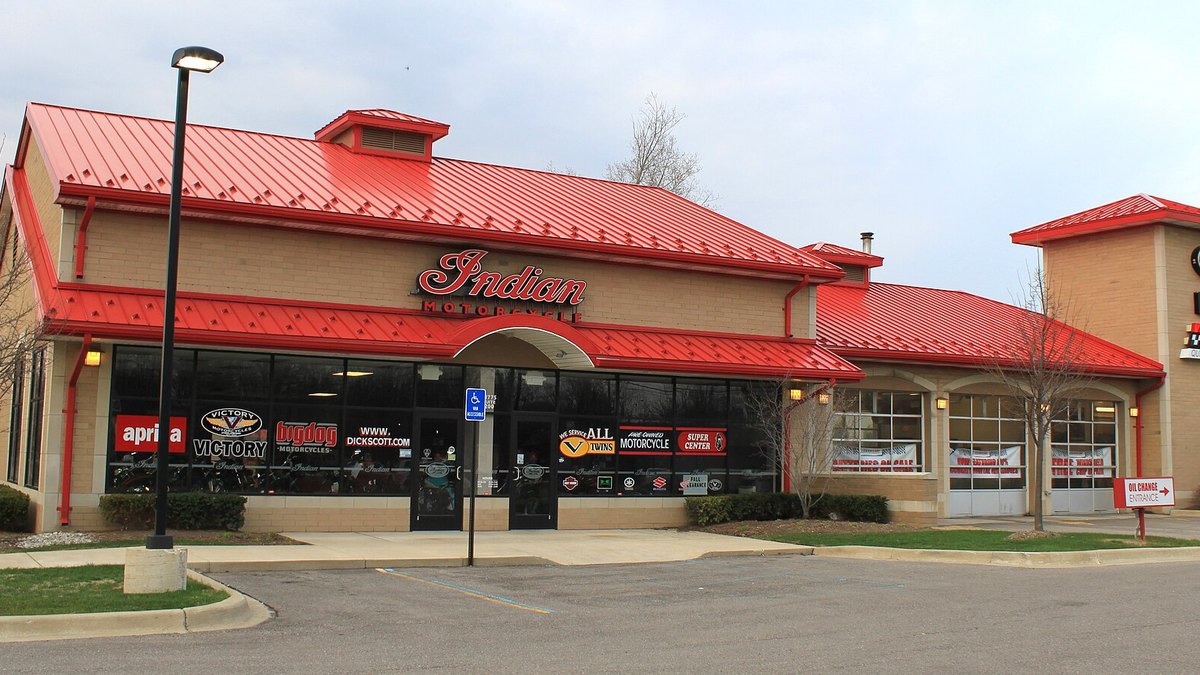
The sales KPIs that matter most for a powersports dealership are new and pre-owned retail units, gross profit per unit, finance and insurance (F&I) income per unit, parts, service and accessories gross and how much overhead it absorbs, inventory and floorplan cost, and lead-to-sale conversion. Customer satisfaction and service throughput sit behind them because they decide whether the next sale and the next repair order happen.
Only some of these have published benchmarks. The best public numbers come from the filings of a large U.S. dealer group, RumbleOn, and from the manufacturer Harley-Davidson. For lead response, close rate, CSI and service hours, no powersports benchmark was found in the sources used here, so this page shows how to compute each one from your own system instead of quoting a number.
Unit sales: new and pre-owned retail
Count retail units by category every month and compare to the same month a year earlier. Keep wholesale separate: RumbleOn defines vehicles sold as units sold through retail and wholesale channels, but its per-unit gross profit uses retail units only.
- RumbleOn new retail units, 2024 vs 202342,464 vs 45,706
- RumbleOn pre-owned retail units, 2024 vs 202318,275 vs 21,840
- RumbleOn pre-owned wholesale units, 2024 vs 20234,249 vs 5,116
Your market matters as much as your store. The Motorcycle Industry Council data reported by Powersports Business shows U.S. new motorcycle and scooter sales down 7.6% in 2025 and ATV sales down 3.5%, with sport bikes up 13%, touring down 13% and cruisers down 6%. Compare your unit mix to those segments before deciding whether a drop is yours or the market's.
Gross profit per unit
Gross per unit is gross profit divided by retail units sold, tracked separately for new and pre-owned. RumbleOn reports new vehicles at $1,705 per unit in 2024 against $2,080 in 2023, and pre-owned at $1,407 against $883. Its pre-owned figure counts wholesale units in the divisor, so it nets wholesale losses against retail gains: $32.5 million retail gross less $0.8 million wholesale loss, over 22,524 units.
F&I income per unit
Divide net F&I income by retail units. RumbleOn's 2024 F&I gross profit was $102.4 million over 60,739 new and pre-owned retail units, which is the $1,686 per vehicle it reports, versus $1,733 in 2023. That is one large dealer group, not an industry average; no industry-wide powersports F&I benchmark was found in the sources used here.
F&I penetration is the share of retail deals with a finance contract, service contract or other product. No published powersports penetration benchmark was found, so track your own by product and by salesperson.
Parts, service and accessories absorption
Absorption measures how much of your overhead the back end covers. Affinitiv gives the NADA formula for fixed absorption: gross profit from parts, service and the body shop, divided by dealership overhead expense that excludes vehicle-selling costs such as commissions and delivery. NADA 20 Group guides suggest adding used-vehicle gross to get an overall rate and aim for as close to 100 percent as possible. These definitions come from car dealers, so adjust the department names for your store.
For scale, RumbleOn's parts, service and accessories gross profit was $94.5 million of its $301.0 million total in 2024, about 31%, or $1,556 per retail unit, down from $1,633 in 2023. Seasonal powersports stores should compute absorption on a trailing twelve months, not a single winter month.
Inventory, days supply and floorplan cost
Days supply is units in stock divided by units sold per day, by category. Floorplan cost per retail unit is floorplan interest divided by retail units. RumbleOn paid $16.0 million of floor plan interest in 2024, about $263 per retail unit, against $13.2 million in 2023, about $195, while net inventory fell from $347.5 million to $240.6 million. Higher cost on lower inventory is the reason to watch this per unit, not just in total. Floorplan rates are variable and vary by lender.
Manufacturers show the same discipline. Harley-Davidson reports worldwide retail sales of new motorcycles down 12.4% in 2025 and retail inventory of approximately 40,000 units at year end, down approximately 17%, attributed to dealers reducing stock and lower shipments. No powersports-wide days supply benchmark was found.
Lead response, close rate, service throughput and CSI
None of these has a published powersports benchmark in the sources used here, so do not trust a number you cannot trace. Compute them yourself:
- Lead response time. Minutes from lead timestamp to first human contact, reported as a median and by source.
- Close rate. Units sold from leads divided by leads worked, split by new, pre-owned and by source.
- Service throughput. Repair orders and billed hours per technician per day, plus the share of repair orders that include a parts or accessory sale.
- CSI. Use the manufacturer survey score for your brand and compare to your own prior periods and your zone, not to a generic figure.
Questions people ask
What are the most important KPIs for a powersports dealership?
Retail units, gross profit per unit, F&I income per unit, parts, service and accessories absorption, inventory days supply with floorplan cost, and lead-to-sale conversion.
What is a good F&I income per unit for a powersports dealer?
No industry-wide benchmark was found. RumbleOn, a large dealer group, reported $1,686 per vehicle in 2024 and $1,733 in 2023. Use it as one reference, not a standard. Source: RumbleOn 10-K.
How do I calculate service absorption?
Divide gross profit from parts, service and the body shop by dealership overhead expense, excluding vehicle-selling costs. Source: Affinitiv on the NADA formula.
Sources
- RumbleOn, Inc. Form 10-K, fiscal 2024 · Unit sales, gross per unit, F&I, parts and service, floorplan interest, inventory
- Harley-Davidson, Inc. Form 10-K, fiscal 2025 · Retail sales and dealer inventory
- Powersports Business: MIC 2025 sales report · U.S. market and segment changes
- Affinitiv: absorption rate · NADA fixed absorption formula
Figures were read from the linked pages on October 28, 2026. RumbleOn numbers are one dealer group's results, and per-unit figures not printed in its filing were computed from its published totals. Retail and absorption definitions come from filings and car-dealer sources; check them against your manufacturer and accounting setup.
Top photo: Dwight Burdette / CC BY 3.0 via Wikimedia Commons