What Are the Key Sales KPIs for the Athletic Apparel and Footwear Industry in 2027?

The sales KPIs that matter most in athletic apparel and footwear are the direct-to-consumer versus wholesale revenue mix, digital sales growth, gross margin (read net of tariff effects), inventory levels against sales, comparable store sales, the price actually realized at full price, and the health of the wholesale order book. Public companies disclose some of these well and others not at all, so this page gives only figures read in company filings and earnings releases, with the period for each. On Holding reported DTC at 45.7% of second-quarter 2026 net sales and a 65.4% gross profit margin, while PUMA reported a 33.1% DTC share and a 49.5% margin for its third quarter. Nike's digital sales fell to $8.6 billion in fiscal 2026 from $9.6 billion, and its comparable store sales decreased 4%.
The 2026 margin numbers need care: Nike, lululemon, adidas, PUMA and Under Armour all booked tariff refunds in recent quarters, which lifted reported gross margin, so compare the company's own explanation, not the headline. No source read here publishes an industry benchmark for full-price sell-through, markdown rate, customer retention or loyalty membership, and the only average order value benchmark found is from an analytics vendor, so none of those is invented. Every source was read on October 31, 2026. This page is not financial advice.
DTC versus wholesale revenue mix
The first KPI is how revenue splits between a brand's own channels (stores and digital, called direct-to-consumer or DTC) and wholesale sales to retailers, because the split drives margin, inventory risk and how much of the customer relationship the brand owns. Brands report it differently, so quote the company's own definition and period.
- On Holding, second quarter 2026 (company-reported)DTC net sales of CHF 388.4 million, up 26.0%, a second-quarter high of 45.7% of net sales; wholesale CHF 461.9 million, up 4.8%.
- PUMA, third quarter 2026 (company-reported)DTC share of 33.1%, up from 30.5% a year earlier; wholesale EUR 1,187.9 million, down 9.6% currency-adjusted, DTC EUR 588.3 million, up 1.2%.
- NIKE, fiscal 2026, year ended May 31, 2026 (company-reported)NIKE Direct $17.7 billion, down 6%; wholesale $27.5 billion, up 6%.
- Deckers, first quarter fiscal 2027, quarter ended June 30, 2026 (company-reported)DTC net sales up 13.0% to $352.8 million; wholesale up 2.2% to $666.7 million.
- Under Armour, first quarter fiscal 2027, quarter ended June 30, 2026 (company-reported)DTC revenue decreased 6% to $437 million; wholesale decreased 2% to $638 million.
The same mix can move in opposite directions. Nike's fiscal 2026 10-K says it is repositioning its digital platform as a full-price platform and reinvesting in wholesale distribution, so a falling DTC line there is partly a deliberate choice. adidas reported in its third quarter 2026 release that DTC grew 17% currency-neutral while wholesale grew 2%, as it kept a conservative sell-in approach to wholesale accounts. Track the mix every quarter, and read it with the margin and inventory lines below.
Digital penetration and e-commerce growth
Digital penetration is the share of sales through a brand's own web and app channels, and its growth rate shows whether online demand is real or promotion-driven. Few athletic companies publish the share itself, so the more reliable disclosure is the growth rate of digital or e-commerce sales.
- Nike. NIKE Brand Digital sales were $8.6 billion in fiscal 2026 against $9.6 billion in fiscal 2025, with declines primarily due to reduced traffic, per its 10-K. In the quarter ended August 31, 2026 it fell 13% and NIKE-owned stores fell 5%.
- adidas. E-commerce revenues were up 18% and own retail up 16% in the third quarter 2026, and e-commerce was up 23% in the first nine months.
- PUMA. E-commerce grew 7.8% currency-adjusted in the third quarter 2026 while owned and operated retail stores fell 2.3%.
- Under Armour. eCommerce revenue decreased 12% in the quarter ended June 30, 2026, while owned-and-operated store revenue declined 3%.
- lululemon. In fiscal 2025 (ended February 1, 2026) e-commerce net revenue was $4,918,697 thousand against $5,049,744 thousand for company-operated stores and $1,134,159 thousand for other channels, on total net revenue of $11,102,600 thousand.
The pattern for 2026 is dispersion: the same year shows digital growing at adidas and PUMA and shrinking at Nike and Under Armour. A single industry digital-share benchmark would hide that, so compare to the peer set you actually compete with.
Gross margin, and what to strip out
Gross margin is the KPI that shows whether growth is profitable, but 2026 reporting is distorted. Several companies booked refunds of tariffs that had been paid earlier, which lifted reported margin for the quarter in which they were recorded. Read each company's own breakdown.
- On Holding, second quarter 2026 (company-reported)Gross profit margin of 65.4%, up 3.9 percentage points from 61.5%; full-year 2026 expected at least 65.0%.
- Deckers, fiscal 2026, year ended March 31, 2026 (company-reported)Gross margin of 57.7% compared to 57.9%; first quarter fiscal 2027 was 56.4% compared to 55.8%.
- adidas, third quarter 2026 (company-reported)Gross margin up 2.5 percentage points to 54.3% from 51.8%, including a tariff refund of around EUR 200 million.
- lululemon, second quarter fiscal 2026, quarter ended August 2, 2026 (company-reported)Gross margin of 60.5%, up 200 basis points from 58.5%, with tariff refunds adding 560 basis points.
- NIKE, fiscal 2026 and first quarter fiscal 2027 (company-reported)Fiscal 2026 gross margin 42.9%, up 20 basis points; fourth quarter 49.2% including about 900 basis points from expected tariff recovery; quarter ended August 31, 2026 was 42.8%.
- Under Armour and PUMA (company-reported)Under Armour first quarter fiscal 2027 gross margin 54.1%, up 590 basis points; PUMA third quarter 2026 gross profit margin 49.5% versus 45.4%, with tariff refunds of EUR 29.8 million contributing about 170 basis points.
adidas also names the operating drivers behind its margin beyond the refund: healthy full-price sales and a favorable channel mix. On Holding attributes its higher margin to the DTC mix and freight efficiencies in its release. Those are the underlying levers worth tracking by channel, category and region.
Inventory, turns and days of inventory
Inventory against sales is the early-warning KPI. Rising stock relative to sell-through leads to markdowns, and falling stock can signal either discipline or missed demand. None of the filings read here prints an inventory turns or days-of-inventory figure in its earnings release, so the useful public data is the inventory balance and its change.
- NIKE (company-reported)$7.5 billion at May 31, 2026, flat on the prior year; $7.8 billion in the quarter ended August 31, 2026, down 3%.
- adidas, September 30, 2026 (company-reported)EUR 5,739 million, down 4% from the previous quarter and up 2% currency-neutral on the year.
- PUMA, third quarter 2026 (company-reported)Inventories decreased 24.3% reported to EUR 1,608.9 million.
- lululemon, quarter ended August 2, 2026 (company-reported)Inventories of $1.71 billion, down 1% in dollars and down 7% in units.
- Deckers, quarter ended June 30, 2026 (company-reported)Inventories of $807.6 million compared to $849.4 million.
Reading the units matters. lululemon's inventory fell 7% in units against 1% in dollars, and Nike said its flat inventory reflected an increase in units offset by shifts in product mix. To get turns or days of inventory for your own business, divide cost of goods sold by average inventory on your own books and compare quarter to quarter, since the public releases give only the balances.
Full-price sell-through and markdown rate
Full-price sell-through is the share of units sold at the original ticket price, and markdown rate is the share of sales given away in discounts. They are the cleanest measures of brand heat, and the least disclosed.
- Brands protecting full price. adidas said in its third quarter 2026 release that it managed wholesale sell-in conservatively to protect its full-price product franchises within a promotional marketplace. Deckers' fiscal 2026 release quotes its CEO saying the company continues to drive full-price demand.
- Brands clearing stock. Nike's fiscal 2026 10-K describes liquidating inventory through increased markdowns across NIKE Direct and higher sales returns and discounts with wholesale partners.
- Retailers seeing promotion. DICK'S Sporting Goods said in its second quarter 2026 release (quarter ended August 1, 2026) that portions of the athletic footwear and apparel marketplace became increasingly promotional.
Comparable store sales
Comparable store sales measure same-store growth, excluding new openings, so they separate demand from expansion. Definitions differ: lululemon's includes company-operated stores and e-commerce, while Nike's metric covers its owned stores.
- lululemon, second quarter fiscal 2026, quarter ended August 2, 2026 (company-reported)Comparable sales down 9% (down 10% in constant dollars); Americas down 12%, International down 3%.
- lululemon, fiscal 2025, year ended February 1, 2026 (company-reported)Comparable sales increased 2%; Americas comparable sales decreased 3%.
- NIKE, fiscal 2026 (company-reported, 10-K)Comparable store sales decreased 4% overall; North America down 2%, EMEA down 7%, Greater China down 6%.
- Deckers, first quarter fiscal 2027 (company-reported)DTC comparable net sales increased 6.8%; fiscal 2026 DTC comparable net sales increased 4.6%.
- DICK'S Sporting Goods, quarter ended August 1, 2026 (retailer, company-reported)DICK'S Business comp sales growth of 4.9%; proforma comps for the Foot Locker Business declined 3.6%.
Retailers matter because they sell the brands. DICK'S said its comp growth came with growth in average ticket and transactions, though it did not publish the figures, and it attributed Foot Locker's weakness to conditions in the athletic footwear marketplace.
Average order value and conversion
Average order value (AOV) is revenue per online order, and it moves with promotions, bundles and free-shipping thresholds. Public athletic brands do not report AOV in their earnings releases, so the only benchmark found is from an analytics vendor.
- Littledata, fashion and apparel stores on Shopify (analytics vendor, 90 days to October 24, 2026)Median average order value $113 against $110 for all Shopify stores; best 20% at $298; median conversion rate 1.0%; median cart abandonment 81%.
Treat it with caution. The sample is 76 Shopify stores in fashion, clothing and apparel, including shoes and footwear, so it skews to smaller direct brands and is not an athletic-only or large-brand figure. It is a vendor's measurement of its own customers, not an industry census. Use it to sanity-check your own order value and conversion, and set your target against your own price points.
Customer retention and loyalty membership
Retention (the share of customers who buy again) and loyalty membership (enrolled members and their spend share) are how brands judge whether DTC growth is repeat demand. They are among the most valuable and least disclosed KPIs.
Wholesale order book and futures
For brands that sell through retailers, the order book is the leading indicator of next season's wholesale revenue. Nike's fiscal 2026 10-K describes its futures ordering program, in which certain customers can place orders five to six months ahead of delivery, and notes that these advance orders may be canceled under certain conditions. Its earnings releases read for this page do not print a futures or order-book figure.
Without a disclosed order book, the best public signals are sell-in commentary and wholesale growth. adidas said it held wholesale sell-in at a conservative level, and wholesale grew 2% in its third quarter 2026 and 6% in the first nine months. PUMA's wholesale revenue fell 9.6% currency-adjusted in its third quarter. Nike's wholesale revenue was $6.8 billion in the quarter ended August 31, 2026, down 1%, after growing 6% in fiscal 2026, with North America wholesale up 14% in the fiscal year. For your own business, track booked orders by season, cancellations, and the share of orders filled on time.
Customer concentration is part of the same picture. Nike's 10-K says no customer accounted for 10% or more of its consolidated revenues in fiscal 2026.
A scorecard to start with
Read together, the filings point to a short monthly scorecard rather than a long list.
- Mix. DTC versus wholesale revenue and growth, by region.
- Digital. E-commerce growth, traffic and conversion.
- Margin. Gross margin by channel, with tariff effects shown separately.
- Inventory. Balance, units, turns and days of inventory against sales.
- Price. Full-price sell-through and markdown rate by style.
- Stores. Comparable store sales, ticket and transactions.
- Customers. Order value, repeat rate and loyalty share of sales.
- Wholesale. Order book, cancellations and sell-through at retail.
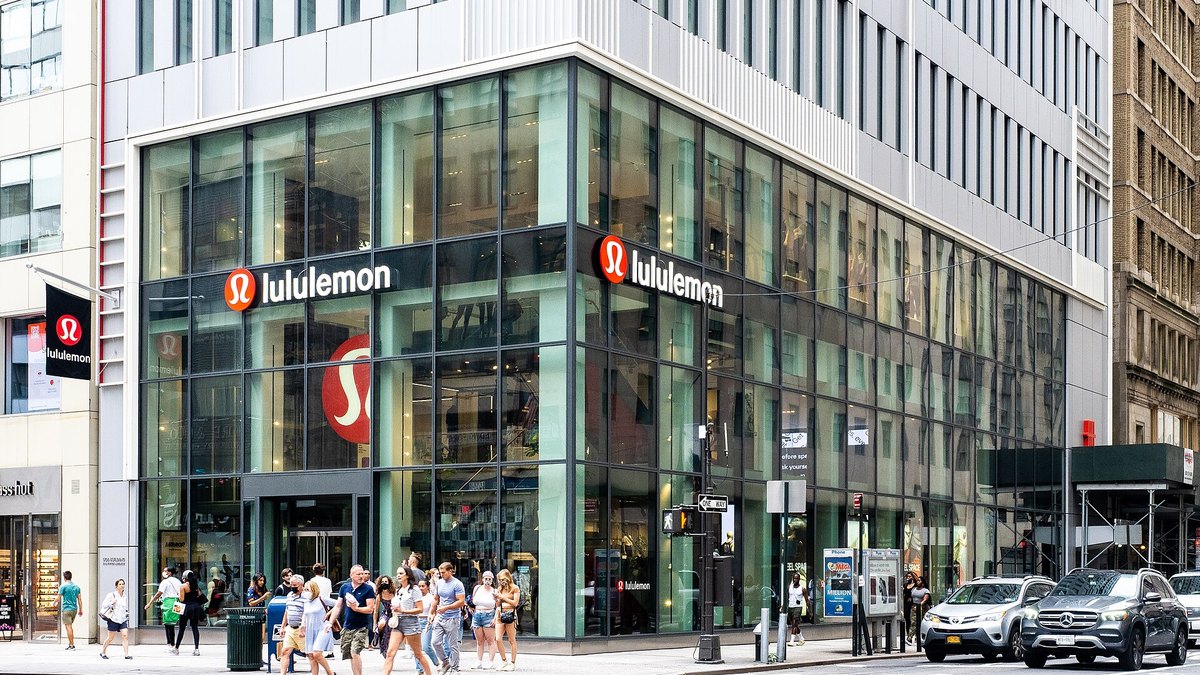
Sales pressure explains the urgency. For its full year, Nike reported fiscal 2026 revenues of $46.4 billion, flat on a reported basis, and expects fiscal 2027 revenues to decline high-single digits. Under Armour expects fiscal 2027 revenue to decline at a mid-single-digit rate, while adidas expects currency-neutral revenue growth of 9% to 10% for 2026.
Questions people ask
What are the most important sales KPIs for an athletic apparel and footwear company?
DTC versus wholesale mix, digital growth, gross margin, inventory against sales, comparable store sales, full-price sell-through and markdown rate, order value, retention, and the wholesale order book. Company releases cover mix, margin, inventory and comps best; sell-through, retention and order book are rarely disclosed.
What share of sales do athletic brands make direct to consumer?
It varies by brand. On Holding reported DTC at 45.7% of second-quarter 2026 net sales and PUMA reported 33.1% for its third quarter 2026. Nike reported NIKE Direct of $17.7 billion and wholesale of $27.5 billion for fiscal 2026.
What gross margin do athletic brands earn?
Recent company-reported figures include On Holding at 65.4% (second quarter 2026), Deckers at 57.7% (fiscal 2026), adidas at 54.3% (third quarter 2026) and Nike at 42.9% (fiscal 2026). Several include one-time tariff refunds, so read the company's own explanation.
What is a good average order value for an athletic apparel brand?
The only benchmark found is from analytics vendor Littledata: a median of $113 for fashion and apparel Shopify stores over the 90 days to October 24, 2026, with the best 20% at $298. It is not an athletic-only figure, so compare to your own price points.
Is there a published benchmark for full-price sell-through, markdown rate or retention?
Not in any source read for this page. Companies describe full-price selling and markdowns in words, and none of the releases read publishes a retention rate or loyalty member count.
Sources
- NIKE, Inc.: fiscal 2026 fourth quarter and full year results (SEC 8-K exhibit), June 30, 2026 · Fiscal 2026 NIKE Direct, wholesale, gross margin and inventories
- NIKE, Inc.: Form 10-K for fiscal year ended May 31, 2026 · Digital and store sales, comparable store sales, markdowns, futures ordering program
- NIKE, Inc.: fiscal 2027 first quarter results · Quarter ended August 31, 2026 channel revenue, margin, inventories, outlook
- lululemon athletica inc.: second quarter fiscal 2026 results, September 3, 2026 · Comparable sales, gross margin and inventories
- lululemon athletica inc.: Form 10-K for fiscal year ended February 1, 2026 (PDF copy) · Net revenue by channel and fiscal 2025 comparable sales
- Deckers Brands: first quarter fiscal 2027 results, July 23, 2026 · DTC and wholesale sales, DTC comparable, gross margin, inventories
- Deckers Brands: fourth quarter and full fiscal year 2026 results, May 21, 2026 · Fiscal 2026 channel sales, gross margin and full-price comment
- On Holding AG: second quarter 2026 results, August 11, 2026 · DTC share, wholesale and gross profit margin
- adidas AG: third quarter 2026 results, October 29, 2026 · Channel growth, gross margin, inventories, sell-in approach
- PUMA SE: Q3 2026 results, October 30, 2026 · Wholesale, DTC share, gross margin and inventories
- Under Armour: first quarter fiscal 2027 results (SEC 8-K exhibit) · Wholesale, DTC, eCommerce and gross margin
- DICK'S Sporting Goods: second quarter 2026 results (SEC 8-K exhibit) · Retailer comparable sales, promotional environment, inventory
- Littledata: fashion and apparel ecommerce benchmarks (analytics vendor) · Median average order value and conversion on Shopify fashion stores
Figures were read from the linked pages on October 31, 2026. Company figures are company-reported, and the vendor figure is labelled as such. Where no credible benchmark was found, the page says so instead of estimating. Photos: Wikimedia Commons, credited on the page. This page is not financial advice.
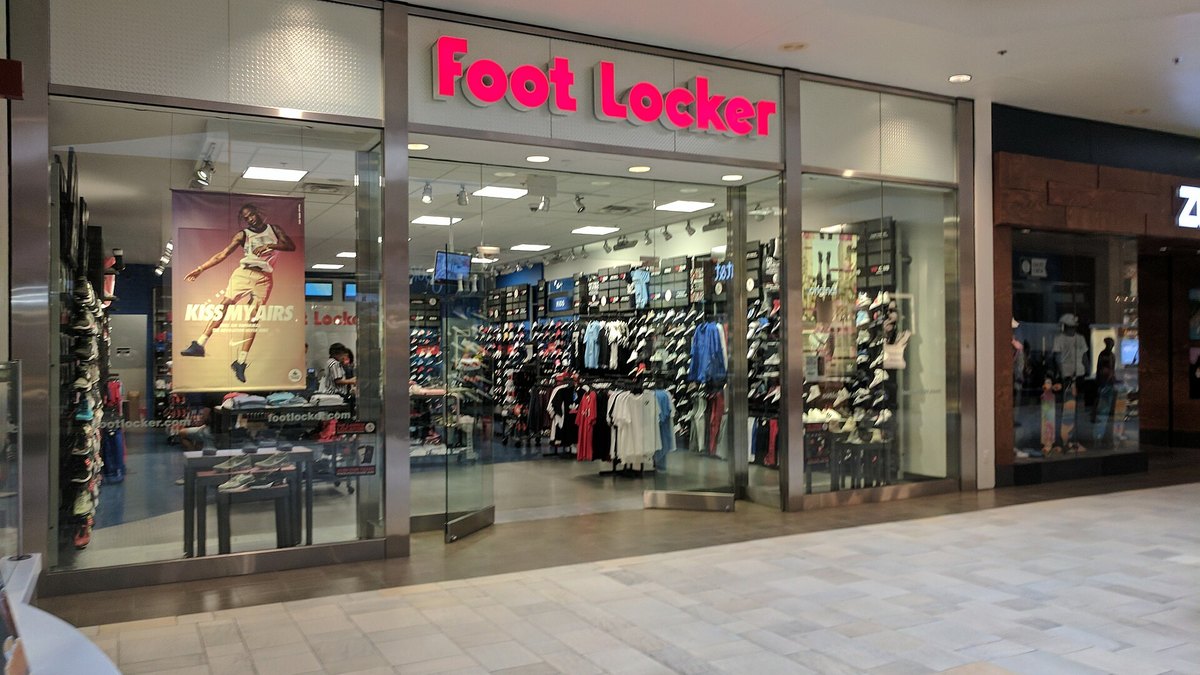
Top photo: ArnoldReinhold / CC BY-SA 4.0 via Wikimedia Commons