What Are the Key Sales KPIs for the Aviation MRO Industry in 2027?
The sales KPIs that matter most for an aviation maintenance, repair and overhaul (MRO) provider are RFQ win rate, quote turnaround time, contract backlog, aircraft, engine and component share of revenue, turnaround time (TAT) as a sales lever, customer retention and renewal on power-by-the-hour contracts, revenue per labor hour, parts margin versus labor margin, AOG (aircraft on ground) response, and customer concentration. The company-reported figures this page could read are ST Engineering's record order book of $35.7b (Singapore dollars) at the end of June 2026, Lufthansa Technik's 5,100 aircraft under long-term component contracts at the end of 2025, and AAR's commercial customers at 73% of sales in the quarter ended August 31, 2026. No official industry average could be read, and this page does not invent one.
Each MRO company defines its metrics in its own way, so each figure below is attributed to the company and period that reported it. Every formula is a working definition for you to measure on your own records. Sources were read on November 8, 2026. This page is not financial advice.
Win rate on RFQs
An MRO sale usually starts as a request for quote (RFQ) from an airline, lessor or operator, so the first sales KPI is how many of those requests you win.
- RFQ win rate. RFQs won divided by RFQs answered, as a percentage, counted by customer request and not by work-order line. Split by work type (airframe, engine, component, line) and by customer type.
- Value-weighted win rate. Quoted value of won RFQs divided by quoted value of all RFQs answered. A high count win rate on small jobs can hide a low win rate on heavy checks.
- Qualified-RFQ share. RFQs you had the capability, approvals and slots to perform divided by all RFQs received. It shows how much demand you could never have won.
- Loss reasons. Lost RFQs coded as price, turnaround time, slot availability, capability or approval, so that win rate can be acted on.
- Public benchmark for RFQ win rate (not published)None of the company pages read for this page gives a figure for this KPI, so none is given.
None of the public MRO companies read for this page reports an RFQ win rate, so measure it from your own quote log. The closest public signal is contract volume won, covered under backlog below.
Quote turnaround time
An operator with an aircraft or engine out of service wants a price quickly. A slow quote often loses the work to the next shop, so quote speed is a sales KPI and not just an admin one.
- Median quote turnaround. Median hours from receipt of a complete RFQ to the quote sent. Use the median, and report the slowest tenth separately, because a few engineering-heavy quotes will distort an average.
- Quote on time rate. Quotes sent within the commitment for that work type divided by all quotes sent, as a percentage.
- Revision count. Average number of quote revisions before the customer accepts or declines. Findings on teardown change scope, so track initial quote against final invoice separately.
- Public benchmark for quote turnaround time (not published)None of the company pages read for this page gives a figure for this KPI, so none is given.
Quote speed has no published company benchmark. Compare it with your own win rate by speed band to see whether faster quotes actually win more work.
Contract backlog
Backlog is the signed work not yet delivered, and in MRO it shows how much of the next year is already sold.
- Backlog. Value of signed contracts and accepted quotes not yet recognized as revenue, at the measurement date.
- Backlog coverage. Backlog expected to be delivered in the next period divided by the revenue forecast for that period, as a percentage.
- Book-to-bill. Contract value won in the period divided by revenue recognized in the period. A ratio above one means backlog is growing.
- Backlog by work type and customer. The same figure split into airframe, engine, component and line maintenance, and by the largest customers, so that backlog is not read as one block.
- ST Engineering, group order book (news release, 13 August 2026, period ended 30 June 2026)The group ended the first half of 2026 with a record order book of $35.7b (Singapore dollars), of which about $5.7b was expected to be delivered in the remaining months of 2026. It secured about $7.6b of new contracts in the first half, of which $1.2b came from Commercial Aerospace in the second quarter. These are group figures that include defence and urban businesses, not MRO alone.
- Lufthansa Technik, new contracts (Lufthansa Group Annual Report 2025, year ended December 31, 2025)In 2025 it signed 1,149 new contracts with a volume of EUR 8.8bn, EUR 0.9bn of which was with companies in the Lufthansa Group, and acquired sixteen new customers.
ST Engineering and Lufthansa Technik each define the figure on their own basis, so compare the method before the numbers.
Aircraft, engine and component share of revenue
Revenue mix shows where the sales effort is paying. Engine, component and airframe work have different margins, capacity needs and customer types, so a mix that drifts is a sales signal.
- Share of revenue by work type. Revenue from each of airframe (base and line), engine, component and other services divided by total MRO revenue, as a percentage.
- Mix change. The share this period minus the share in the same period a year ago, in percentage points, so that a shift is visible even when total revenue is flat.
- Share of revenue by platform. Revenue by aircraft or engine family divided by total revenue. It shows exposure to one type, such as a single narrowbody or engine.
- Lufthansa Technik, revenue by unit (Lufthansa Group Annual Report 2025)The Engine Services unit "generates almost half of Lufthansa Technik's revenue" and Aircraft Component Services realises "more than one third of the company's revenue." Total MRO segment revenue was EUR 8,049m in 2025, up 12% from EUR 7,183m.
- ST Engineering, Commercial Aerospace segment (1H2026)Segment revenue grew 15% year over year to $2.69b from $2.35b (Singapore dollars), "driven by higher revenues from Engine MRO, Nacelles and spares sales." Group commercial sales were $4.6b and defence sales $2.0b.
The two companies describe their mix in different words: Lufthansa Technik gives rough shares by unit, and ST Engineering names the drivers of growth. Neither gives a full percentage table in the pages read.
Turnaround time (TAT) as a sales lever
For an operator, every day in the hangar is a day without revenue, so turnaround time is both an operations KPI and a reason to buy.
- Average TAT. Days from aircraft or part induction to release to service, by work type. Report the median and the slowest tenth.
- On-time delivery. Work orders released on or before the promised date divided by all work orders released, as a percentage.
- TAT versus quote. Actual days divided by days quoted for the same work orders. Values above one are the delays that cost renewals.
- Win rate by TAT band. RFQ win rate split by the TAT you quoted, to price speed.
- AAR, fiscal year 2026 annual report (fiscal year ended May 31, 2026)The shareholder letter says AAR delivered "industry leading turnaround times at our Airframe MRO facilities." The page read gives no TAT in days and no definition of the claim.
Because the claim has no published method, treat it as the company's positioning. Use your own induction and release dates to measure TAT.
Customer retention and renewal on power-by-the-hour contracts
Power-by-the-hour (PBH) and other long-term support contracts turn a repair customer into repeat revenue. The sales KPIs are how many aircraft are covered, how many contracts renew, and how many new customers join.
- Contract renewal rate. Contracts renewed or extended divided by contracts reaching term in the period, as a percentage. Count by contract value as well as by number.
- Aircraft or engines under long-term contract. Fleet units covered by a PBH or long-term support agreement at period end, and the growth against the prior year.
- Logo retention. Customers active at the start of the period who are still active at the end, divided by customers at the start.
- New-customer count. Customers with their first contract in the period.
- Lufthansa Technik, long-term component contracts (Lufthansa Group Annual Report 2025)It serviced "some 5,100 aircraft under long-term component contracts at the end of the 2025 financial year," 6% more than in the previous year, and signed 1,149 new contracts and acquired sixteen new customers in the year.
- AAR, new parts Distribution contracts (fiscal year 2026 annual report)AAR reports "a 100% renewal rate for our new parts Distribution contracts." This is a parts distribution measure, not a PBH renewal rate, and the page gives no definition.
No company read for this page publishes a PBH renewal rate, so use the formulas above on your own contract register.
Revenue per labor hour
Revenue per labor hour links sales pricing to shop capacity. It shows whether the work you win earns enough for the technician time it consumes.
- Revenue per labor hour sold. Labor revenue billed divided by direct labor hours billed.
- Revenue per available hour. Labor revenue divided by all paid direct hours, including idle time. The gap to the previous figure is lost capacity.
- Labor utilization. Direct hours billed divided by hours available, as a percentage.
- Revenue per employee. Segment revenue divided by average headcount, when hours are not available.
- Lufthansa Technik, inputs only (Lufthansa Group Annual Report 2025)MRO segment revenue was EUR 8,049m and the segment had 22,989 employees as of 31 December 2025 (22,580 on average). The report gives no revenue per labor hour, and this page does not compute one.
Staff shortages are named in the same report: "the staff shortage in production areas continued to reflect the multiple-year training and skill-building programmes in the MRO field." Capacity, not demand, can set the ceiling on this KPI.
Parts margin versus labor margin
MRO revenue is a blend of labor and material. The sale is worth more or less depending on which one it carries, so track them apart.
- Labor margin. Labor revenue minus direct labor cost, divided by labor revenue.
- Parts margin. Parts revenue minus parts cost (including freight and duty), divided by parts revenue.
- Parts share of work order. Parts revenue divided by total work-order revenue. A rising share lowers revenue per labor hour and changes the quote approach.
- Pass-through recovery. Cost increases (such as tariffs) billed to customers divided by those cost increases incurred.
- AAR, first quarter fiscal year 2027 (press release, September 28, 2026)Adjusted EBITDA margin was 12.7%, up from 11.7%. Total adjusted EBITDA margin from the Parts Supply, Repair, Engineering & Software, and Government Solutions segments was 13.3%. The release gives no separate parts and labor margin.
- Lufthansa Technik, 2025 (Lufthansa Group Annual Report 2025)Adjusted EBIT margin was 7.5%, down from 8.5%, with a weaker US dollar and US tariffs named as factors. The company says the additional tariff costs are "to be passed on to customers as far as possible" in the medium term.
- ST Engineering, Commercial Aerospace EBIT (1H2026)Segment EBIT rose 29% to $288m from $223m (Singapore dollars), "contributed by higher revenue, a more favourable product mix and productivity savings."
Each company defines its margin differently (adjusted EBITDA, adjusted EBIT, EBIT), so the three figures are not comparable with each other.
AOG (aircraft on ground) response
An aircraft on ground (AOG) event is an unplanned grounding, and the customer buys on response time. The sales KPIs are how fast you answer and how often you solve it.
- Response time. Median minutes from AOG request to a confirmed plan (part located, technician dispatched, or slot given).
- Fill rate. AOG requests fulfilled from stock or pool divided by AOG requests received, as a percentage.
- Time to ship. Median hours from request to part shipped, or to technician on site.
- AOG revenue and premium. AOG revenue divided by total revenue, and the price premium over standard terms.
- AAR, AOG coverage (fiscal year 2026 annual report)The report lists a "Worldwide 24/7 AOG" contact line. It states no response-time or fill-rate figure.
Because AOG buyers often pay a premium for speed, check that the premium covers the cost of holding stock and standby crews.
Customer concentration
Concentration is the risk side of the sales picture: how much revenue depends on a few customers, one customer type or one end market.
- Top-customer share. Revenue from the largest ten customers divided by total revenue. Report the single largest customer on its own too.
- Commercial versus government share. Revenue from commercial customers and from government customers, each as a share of total.
- Related-party share. Revenue from a parent or affiliate divided by total revenue. It matters when a captive customer can leave.
- Customer count. Active customers in the period, and the revenue per customer.
- AAR, first quarter fiscal year 2027 (period ended August 31, 2026)Sales to commercial customers were 73% of consolidated sales, compared with 71% in the prior year quarter. Government sales rose 14%.
- Lufthansa Technik, customer base (Lufthansa Group Annual Report 2025)The company serves "more than 800 customers worldwide." About one quarter of its business comes from Lufthansa Group entities and three quarters from outside customers; revenue with Lufthansa Group companies was EUR 2,005m in 2025, down 12%.
The release and report give no top-customer percentage, so concentration by named customer has to come from your own invoices.
Industry data that could not be read
The brief for this page asked for industry-wide figures from official sources wherever they could be read. None could be, and the page does not fill the gap with estimates.
- AAR investor site, HEICO, FTAI Aviation and Air France-KLM. These hosts returned a 403 error to requests with no user agent, and this page stopped requesting from each of them. The AAR figures come from AAR's main company site, which answered.
- FAA repair station counts (14 CFR Part 145) and BLS data for NAICS 488190. The FAA pages tried returned a not-found error, and the BLS page returned a 403 error. No count of repair stations or industry payroll is quoted.
- Census Bureau data for NAICS 488190. The API asked for a key, so no establishment or employment figure is quoted.
A scorecard to start with
One row per KPI, with the owner who watches it and how often. Targets come from your own history, since no industry average was found.
- Weekly, sales and commercial lead. RFQ win rate, quote turnaround, AOG response and fill rate, TAT against quote.
- Monthly, MRO commercial and operations. Revenue by work type, revenue per labor hour, labor utilization, parts share of work order, on-time delivery.
- Quarterly, finance and account management. Backlog and coverage, book-to-bill, PBH renewal and aircraft under contract, parts and labor margin, customer concentration.
Questions people ask
What are the key sales KPIs for an aviation MRO company?
RFQ win rate, quote turnaround time, contract backlog, revenue share by aircraft, engine and component work, turnaround time, renewal on power-by-the-hour contracts, revenue per labor hour, parts and labor margin, AOG response and customer concentration. The page gives a formula for each.
How do you calculate RFQ win rate in MRO?
RFQs won divided by RFQs answered, as a percentage, counted by customer request. Also track the value-weighted version, which divides the quoted value of won RFQs by the quoted value of all RFQs answered. No public MRO company read for this page reports its own win rate.
What is contract backlog for an MRO provider?
It is the value of signed contracts and accepted quotes not yet recognized as revenue. ST Engineering reported a record group order book of $35.7b (Singapore dollars) at 30 June 2026, which includes defence and urban businesses as well as aerospace MRO.
Why does turnaround time matter for MRO sales?
Each day an aircraft or engine is in the shop is a day without revenue for the operator, so shorter, reliable turnaround wins renewals. AAR says it delivered industry leading turnaround times at its Airframe MRO facilities in fiscal year 2026, but publishes no method or day count.
Is there an official industry average for these KPIs?
None could be read for this page. The company figures above are for stated companies and periods only, and the FAA, BLS and Census pages for NAICS 488190 could not be read.
Sources
- ST Engineering: Delivers Strong 1H2026 Performance with Earnings Growth Outpacing Revenue Growth, 13 August 2026 · Group order book, Commercial Aerospace revenue and EBIT, commercial and defence sales
- AAR: AAR reports first quarter fiscal year 2027 results, September 28, 2026 · Sales, adjusted EBITDA margin, commercial share of sales
- AAR: 2026 Annual Report (fiscal year ended May 31, 2026) · Turnaround time claim, 100% renewal rate on new parts Distribution contracts, 24/7 AOG line
- Lufthansa Group: Annual Report 2025, MRO business segment (year ended December 31, 2025) · Lufthansa Technik revenue, mix, contracts, customers, employees, margin
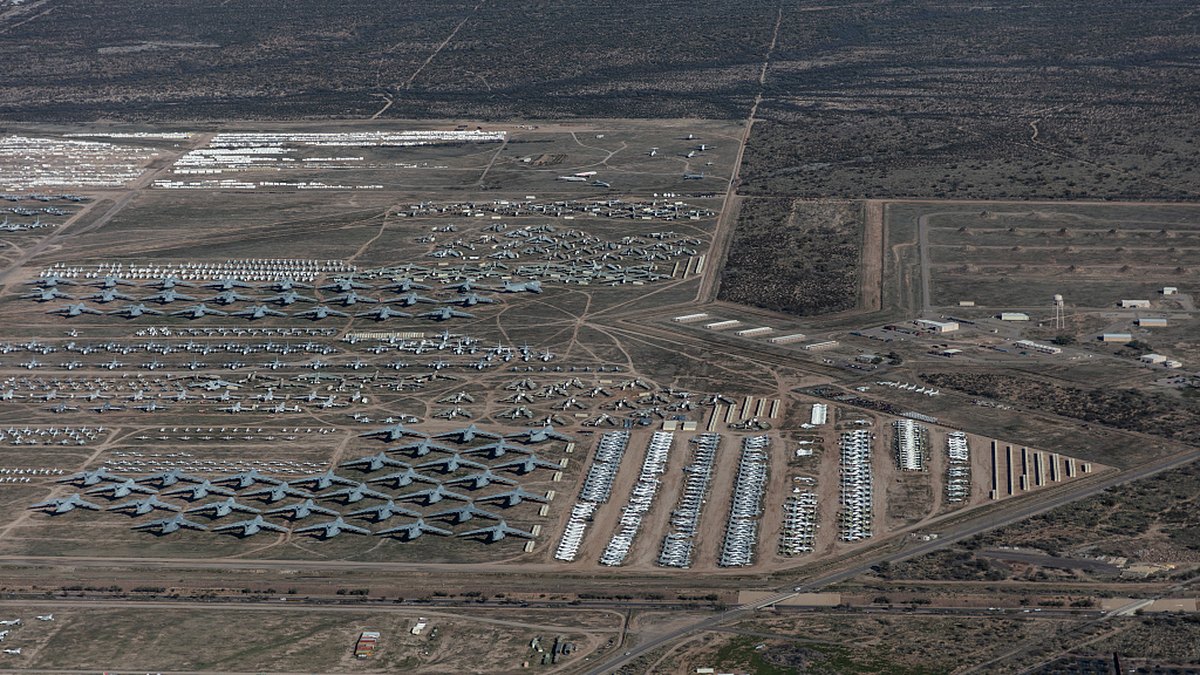
- Library of Congress, Carol M. Highsmith Archive: aerial view of the Davis-Monthan aircraft storage field, Tucson, Arizona (LC-DIG-highsm-55828), no known restrictions on publication · Hero photograph. Credit line: Photographs in the Carol M. Highsmith Archive, Library of Congress, Prints and Photographs Division.
Figures were read on November 8, 2026 from the company pages linked above, for the periods stated. The KPI formulas are working definitions, not published standards. Not read: the HEICO, FTAI Aviation and Air France-KLM investor pages, the AAR investor site, the FAA Part 145 repair station counts and the BLS and Census pages for NAICS 488190, because each blocked requests made with no user agent, was not found, or needed a key, and this page stopped requesting from each blocked host. This page is not financial advice.