What Are the Key Sales KPIs for the Industrial Lubricant & Fluids Distribution Industry in 2027?
The sales KPIs that matter most to an industrial lubricant and fluids distributor are gallons sold, sales growth split into volume and price, gross margin per gallon and as a percentage of sales, sales mix by product family and customer segment, private-label share, win and loss rates on bids and renewals, and the working-capital pair of receivables and inventory days. No public body publishes a current set of benchmarks for lubricant distributors specifically, so this page uses what is public: Census Bureau and BLS data for petroleum wholesalers, a 2025 industry review from JobbersWorld, and the latest results of the lubricant and fluids makers Quaker Houghton and Fuchs. Petroleum merchant wholesalers (NAICS 4247) sold $99,795 million in August 2026 versus $75,413 million a year earlier, up 32.3%, in Census data that are not adjusted for price changes, which shows why volume and price must be tracked separately. U.S. finished lubricant demand in 2025 was preliminarily estimated at about 1,961 million gallons, down about 0.5%, with industrial lubricants the one growing segment, according to the JobbersWorld review of Petroleum Trends International estimates.
Quaker Houghton, a maker of industrial process fluids, reported third-quarter 2026 sales up 10%, of which 7 points were price and mix and 3 points were volume. Figures that no public source states, such as gross margin per gallon, sales per rep or days sales outstanding for lubricant distributors, are described by how to measure them rather than estimated. Every source was read on November 8, 2026. This page is not financial advice.
Gallons sold, against a flat to shrinking market
Volume is the base KPI because lubricants and fluids are sold by the gallon, drum and tote, and because the U.S. market has been shrinking in its biggest segments. Three public series frame the backdrop, each measured differently.
- U.S. finished lubricant demand, 2025 (Petroleum Trends International estimate, via JobbersWorld, preliminary)About 1,961 million gallons, down about 0.5% from a comparable 2024 product slate, versus a 2006 peak of about 2,560 million gallons.
- Segment trend, 2025 (same source)Passenger car and heavy-duty motor oil combined down about 4.5%; industrial lubricants described as the lone growth segment, at about 6.5%.
- EIA product supplied of lubricants (government data, thousand barrels)32,912 in 2025, versus 28,809 in 2024, 30,304 in 2023 and 40,384 in 2022.
The sources do not agree with each other. The JobbersWorld review also says overall demand was preliminarily estimated down about 2 to 3% in another passage, and calls every 2025 volume figure preliminary. EIA's series measures product supplied, a derived figure that moves with inventory changes and is not the same as finished-lubricant demand. For a distributor, the practical use is direction: motor-oil volume is a headwind, so a rep territory that is flat in gallons may be gaining share, and one that is growing in industrial fluids may simply be riding the best segment. Track gallons by product family and by customer, and compare each against the segment trend, not against a total.
Sales growth, split into volume and price
Lubricant and fluid prices follow base oil and additive costs, so reported sales can rise or fall for reasons a sales team did not cause. Producers report the split, and a distributor should too.
- Quaker Houghton net sales, third quarter 2026 (company-reported)$544.5 million versus $493.8 million, up 10%: selling price and product mix added 7 points and volume added 3 points.
- Quaker Houghton price drivers (company-reported)Pricing actions to offset higher raw material costs, changes in product and service mix, and index-based customer contracts.
- Census petroleum merchant wholesalers (NAICS 4247) sales, August 2026 (government data, seasonally adjusted, not price adjusted)$99,795 million versus $75,413 million in August 2025, up 32.3%.
Quaker's disclosure shows the habit worth copying: state how much of growth came from price and mix and how much from volume, and name what drove each. The Census figure covers all petroleum wholesalers, mostly fuels, so it is a signal about price levels in the broader petroleum chain, not a lubricant growth rate. In JobbersWorld's account, 2025 was the opposite situation for lubricants: posted prices barely moved, so growth had to come from accounts and mix. A territory scorecard should show gallons, price per gallon and sales, with the change in each, so that price-driven growth is not mistaken for new business.
Gross margin, per gallon and as a percentage
Margin is where discounting shows up. JobbersWorld reports that transaction-level discounting became increasingly common in 2025, especially in competitive bids and account renewals, and that distributors and blenders often faced a tradeoff between defending volume and preserving margins.
- Quaker Houghton non-GAAP gross margin, third quarter 2026 (company-reported, manufacturer of industrial fluids)35.5% versus 36.8% a year earlier.
- Quaker Houghton adjusted EBITDA, third quarter 2026 (company-reported)$89.8 million versus $82.9 million.
- Fuchs SE, first nine months of 2026 (company-reported, preliminary, lubricant maker)Sales of about 3,126 million euros versus 2,700 million, and EBIT of 409 million euros versus 326 million.
These are manufacturers, not distributors, and their margins are not a target for a distributor. They show how a producer sees the cycle: Quaker's non-GAAP gross margin fell from 36.8% to 35.5% while sales rose 10%, so growth did not bring a higher margin. No source read for this page publishes a gross margin for lubricant distributors, so none is given. To set your own, compute gross profit per gallon and gross margin percent for each product family and customer segment, and watch the gap between the two. Percent margin can hold steady while dollars per gallon fall when prices rise with base oil costs.
Sales mix by product family
A lubricant distributor sells engine oils, hydraulic and gear oils, greases, metalworking fluids, coolants and specialty products, with very different margins and growth. The industry classification itself reflects the breadth.
- NAICS 424720 definition (government classification)Petroleum and petroleum products merchant wholesalers except bulk stations and terminals, with lubricating oil and grease merchant wholesalers among its examples; bulk liquid storage is classed separately in 424710.
- Premium mix, 2025 (JobbersWorld account of distributor practice)Distributors steered demand toward higher-value products, particularly full-synthetic and premium formulations, as a response to margin compression.
- Price sensitivity by product, 2025 (JobbersWorld, blender feedback)Heightened price competition was noted in passenger car motor oil, heavy-duty motor oil and hydraulic fluids.
The KPI is share of sales and gross profit by product family, read with the demand trend for each. Mix toward synthetic and premium grades is a decision the sales team can influence; mix toward commodity grades usually follows price. Because the Census category covers fuels as well as lubricants, its totals describe a wider business than lubricant distribution.
Sales mix by customer segment and the association view
Industrial fluids go to metalworking, manufacturing, fleets, construction and agriculture, while motor oil goes through installers and fleets. Mix by customer matters because the segments are moving in different directions.
- ILMA membership footprint (trade association statement)Since 1948, members produce more than a quarter of the automotive lubricants and three-quarters of the metalworking fluids in North America.
- ILMA distributor membership definition (trade association)Companies marketing and manufacturing lubricants without meeting manufacturing requirements, owning lubricant storage facilities and maintaining product inventories.
- Segment growth, 2025 (JobbersWorld account of Petroleum Trends International data)Commercial automotive lubricants including heavy-duty oils down about 2 to 3%; industrial lubricants the most resilient segment, supported by manufacturing output, infrastructure spending and specialty applications.
ILMA's statement shows that independent blenders make most of the metalworking fluids sold in North America, so a distributor selling into that segment should know which blenders supply it. A scorecard should show sales, gross profit and active accounts by customer segment, plus customer concentration, so a team can see whether it depends on one declining channel. No source read for this page publishes a customer-segment mix for lubricant distributors, so none is given.
Accounts, bids and renewals
Because discounting concentrates in bids and renewals, account-level KPIs are where margin is won or lost.
- Renewal rate and renewal price change. Share of expiring accounts kept, and the price per gallon on renewal versus the old contract.
- Bid win rate and margin on wins. Bids won as a share of bids submitted, with gross profit per gallon on the ones won, so a rising win rate bought with discounts is visible.
- New accounts and first-year gallons. Quaker attributes its third-quarter volume gain mainly to new business wins across all segments, which is the same measure at a producer level.
- Share of wallet and lines per account. Gallons and product families bought per customer, since many accounts buy oil from one source and greases or coolants from another.
Private label and own brand
Private label is both a margin lever and a sales KPI. JobbersWorld reports that private-label lubricants continued to expand as strategic components of distributor portfolios in 2025, supported by investments in branding, technical resources and supply continuity, and that distributor-led acquisitions in the year emphasized scale, breadth of services and resilience.
No source read for this page gives a private-label share for lubricant distributors. The KPI is private-label share of gallons and of gross profit by customer and product family, read against the gross profit per gallon on the same lines. The ILMA distributor membership definition above, covering firms that market lubricants and own storage and inventory, describes the kind of company that runs such programs.
Sales capacity and coverage
Lubricant distribution is a field-sales business, so sales capacity belongs on the scorecard. Public data describe the size of the workforce but not rep productivity.
- BLS QCEW, NAICS 424720, 2025 (government data, private sector)5,749 average establishments and 67,185 average employment, with total annual wages of $8,438,419,742 and average annual pay of $125,600.
- BLS QCEW, NAICS 424720, 2024 (government data)5,784 establishments and 67,182 employment, with average annual pay of $121,766.
- Applied Industrial Technologies fiscal 2026 (company-reported, industrial distributor; read through a fetch summary)Sales of $5.0 billion, up 8.8%, with organic growth of 5.4%; fourth-quarter organic growth of 9.7%.
The QCEW category covers all petroleum products wholesalers outside bulk stations, including fuel and propane dealers, so it overstates lubricant distribution. Its steady employment alongside a modest drop in establishments is the only signal it gives. Applied, which sells industrial products broadly and does not break out lubricants in the release, is an example of reporting organic growth, a measure that strips out acquisitions and currency and is useful for a distributor that buys other distributors.
Inventory, receivables and freight
A distributor of lubricants and fluids holds drums, totes and packaged goods and often owns storage, so working capital and delivery cost belong on a sales scorecard, especially where reps set terms and stocking levels.
- Census inventories-to-sales ratio, NAICS 4247 petroleum, August 2026 (government data)0.35, versus 0.36 in July 2026 and 0.33 in August 2025; the ratio for all merchant wholesalers was 1.18.
- Census petroleum inventories, August 2026 (government data)$34,470 million versus $25,164 million a year earlier, up 37.0%.
- Freight, 2025 (JobbersWorld)Freight emerged as a growing operational variable, influencing cost structure and service reliability, especially for time-sensitive, multi-location and fleet accounts.
The Census ratio is low because petroleum wholesalers move fuel quickly, so it is not a target for a lubricant stocking distributor, whose packaged goods turn more slowly. For your own business, compute days sales outstanding as receivables divided by credit sales, times the days in the period, inventory days from stock value and cost of goods sold, and delivery cost per gallon, each by customer segment. JobbersWorld also notes that standards and compliance now affect inventory management, working capital and channel execution.
A scorecard to start with
Putting these together gives a short monthly scorecard for a lubricant and fluids distribution sales team.
- Volume and growth. Gallons sold by product family and segment, with sales growth split into volume, price and acquisitions.
- Margin. Gross profit per gallon and gross margin percent by product family, customer and rep.
- Mix. Share of sales and gross profit by product family, synthetic and premium share, and private-label share.
- Accounts. Active accounts, new and lost accounts, renewal rate, bid win rate and share of wallet.
- Capacity. Gallons and gross profit per outside rep, and open territories.
- Cash and service. Days sales outstanding, inventory days and delivery cost per gallon.
For peer comparison, the ILMA is the public trade association for independent lubricant makers and distributors, but its member surveys were not read for this page, and the full JobbersWorld and Petroleum Trends International data may sit behind paid access.
Questions people ask
What are the most important sales KPIs for a lubricant and fluids distributor?
Gallons sold, sales growth split into volume and price, gross profit per gallon and gross margin percent, sales mix by product family and customer segment, private-label share, bid and renewal results, and receivables and inventory days.
How big is the U.S. lubricant market?
Petroleum Trends International preliminarily estimated 2025 finished lubricant demand at about 1,961 million gallons, down about 0.5%, according to JobbersWorld's 2025 review. The market peaked at about 2,560 million gallons in 2006, and industrial lubricants were the one growing segment in 2025.
What gross margin do lubricant distributors earn?
No public source read for this page gives one. Quaker Houghton, a producer of industrial fluids, reported a non-GAAP gross margin of 35.5% for the third quarter of 2026, but that is a manufacturer's figure and not a distributor benchmark.
Is there an industry benchmark for sales per rep or bid win rate?
None was found in public sources for this page. Measure them from your own data and compare by customer segment.
How many people work in petroleum products wholesaling?
BLS QCEW data for NAICS 424720 show 67,185 average employment across 5,749 establishments in 2025, with average annual pay of $125,600. The category includes fuels and propane as well as lubricating oils and greases.
Sources
- U.S. Census Bureau: Monthly Wholesale Trade, August 2026 · NAICS 4247 petroleum sales, inventories and inventories-to-sales ratios
- U.S. Census Bureau: 2024 Annual Integrated Economic Survey release, September 3, 2026 · 2024 sales estimate for NAICS 4247
- U.S. Bureau of Labor Statistics: QCEW open data, NAICS 424720 · Establishments, employment and pay, 2024 and 2025
- NAICS Association: NAICS 424720 description · Definition, including lubricating oil and grease merchant wholesalers
- JobbersWorld: 2025 Year in Review · U.S. finished lubricant demand, pricing, discounting, mix, private label, freight
- U.S. Energy Information Administration: U.S. Product Supplied of Lubricants · Annual product supplied of lubricants, 2020 to 2025
- Independent Lubricant Manufacturers Association: About ILMA · Association history and share of North American lubricants and metalworking fluids
- Independent Lubricant Manufacturers Association: How to Join ILMA · Distributor membership definition
- Quaker Houghton: Third Quarter 2026 Results, October 29, 2026 · Sales, price and volume split, non-GAAP gross margin, adjusted EBITDA
- FUCHS SE: preliminary results for the first 9 months of 2026, October 19, 2026 · Nine-month sales and EBIT
- Applied Industrial Technologies: Form 8-K exhibit 99.1, fiscal 2026 fourth quarter (SEC EDGAR) · Fiscal 2026 sales and organic growth
Figures were read from the linked pages on November 8, 2026, except Applied Industrial Technologies, whose SEC filing blocks default fetches and was read through a fetch summary. Company figures are company-reported, the JobbersWorld figures are preliminary third-party estimates, and the Census, BLS and EIA figures are government statistics. Where no credible current benchmark was found, the page says so instead of estimating. This page is not financial advice.
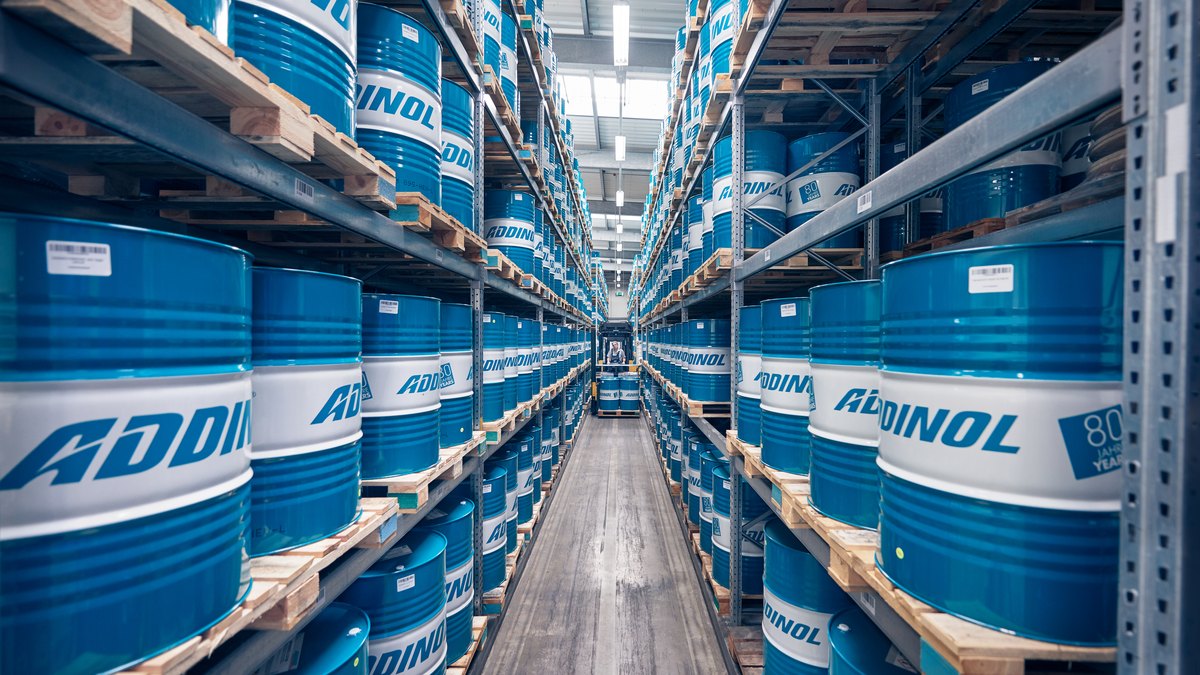
Top photo: Addinoler / CC BY-SA 4.0 via Wikimedia Commons