What Are the Key Sales KPIs for the Quick Service Restaurant (QSR) Franchise Operations Industry in 2027?
The sales KPIs that matter most in quick service restaurant franchise operations are comparable sales, split into guest traffic and average check; average unit volume (AUV); system-wide sales; net unit growth; digital sales mix; franchisee restaurant-level profitability; and the franchisor-side measures of royalty and franchise revenue and franchised share of units. No public body publishes a current benchmark set for franchised QSR units, so this page uses what is public: the third-quarter 2026 results of Restaurant Brands International, McDonald's, Yum! Brands, Domino's, Wingstop and Jack in the Box, Wendy's second-quarter 2026 results, and Bureau of Labor Statistics data for NAICS 722513. Restaurant Brands International reported third-quarter 2026 comparable sales of 3.8%, with Burger King U.S. at 8.4% and Popeyes U.S. at (2.2)%, while Wingstop reported domestic same store sales of (5.4)% and a domestic AUV of $1,848 thousand against $2,061 thousand a year earlier. The spread shows why every KPI must be read by brand and by franchisee, not as one industry number.
Franchisee profit is the hardest KPI to find. None of the releases read for this page states a franchisee restaurant-level margin; Jack in the Box reports the franchisor's own franchise-level margin, at 37.4% of franchise revenue for its third fiscal quarter of 2026. Where no figure is published, this page says so and explains how to measure it. Every source was read on November 8, 2026. This page is not financial advice.
Comparable sales, and what drives them
Comparable sales (also called same-store or same-restaurant sales) is the headline KPI because it strips out the effect of new and closed units. Definitions differ by company, so a franchise operator should compare like with like. Wingstop, for example, defines domestic same store sales as the year-over-year change in sales for restaurants open at least 52 full weeks.
- Restaurant Brands International, Q3 2026 (company-reported)Global comparable sales 3.8%: Burger King U.S. 8.4%, Popeyes U.S. (2.2)%, Tim Hortons Canada 1.8%.
- McDonald's, Q3 2026 (company-reported)Global comparable sales up 1.5% versus 3.6% a year earlier; U.S. down 0.2% versus up 2.4%.
- Yum! Brands, Q3 2026 (company-reported)KFC same-store sales up 1% and Taco Bell down 4%.
- Domino's and Wingstop, Q3 2026 (company-reported)Domino's U.S. same store sales up 0.3% versus 5.2%; Wingstop domestic same store sales down 5.4% versus down 5.6%.
Brands that share a parent can move in opposite directions: RBI's Burger King and Popeyes posted opposite U.S. results in the same quarter. A franchise operator should compare each restaurant with its own brand's figure, because a rise or fall in one unit may simply follow the brand. The Wendy's second-quarter 2026 release, the latest read for that company, reported U.S. same-restaurant sales down 7.0% and international down 2.3%.
Traffic versus average check
Comparable sales can be flattered by price. The useful split is guest counts against average check, because a franchisee can raise prices without winning visits. Few companies publish the split in numbers.
- McDonald's definition (company-reported)Comparable sales are measured against the same period in the prior year; the company reports comparable guest counts alongside them.
- Jack in the Box, Q3 fiscal 2026 (company-reported)System same-store sales down 1.1%, driven mainly by lower transactions and partly offset by higher price; the release does not give the two effects as separate percentages.
- Wendy's, Q2 2026 (company-reported)U.S. company-operated restaurant margin 13.8% versus 16.2% a year earlier.
Jack in the Box shows the pattern to watch: price held up sales while transactions fell. Where a franchisor does not publish traffic, a franchise operator can compute it from its own point-of-sale system as transactions per day and average check per transaction, by daypart and channel, and compare each with the prior year.
Average unit volume (AUV)
AUV is the base of franchisee economics, since rent, labor and royalty all scale with sales. It is also the KPI with the least consistent definition across chains.
- Wingstop domestic AUV, Q3 2026 (company-reported)$1,848 thousand versus $2,061 thousand a year earlier; defined as average annual sales of restaurants open for a trailing 52-week period or longer, company-owned and franchised.
- Jack in the Box, Q3 fiscal 2026 (company-reported)AUV not disclosed in the release.
- Domino's, McDonald's, Yum! Brands and Restaurant Brands (company-reported)Not published: the quarterly releases read for this page give no AUV.
Because most releases omit it, treat AUV as a number to build yourself: trailing twelve-month sales for each restaurant open a full year, averaged by brand, market and format (drive-thru, inline, end-cap, delivery-only). Wingstop's fall shows AUV and same-store sales moving together, but the release read for this page does not break the change into traffic and price.
System-wide sales and what they leave out
System-wide sales add franchised and company restaurants together. They are a franchisor's scale KPI, but a franchisee's sales show only what happens at its own units.
- Restaurant Brands International, Q3 2026 (company-reported)System-wide sales of $12,972 million versus $12,282 million, growth 6.2% on a constant currency basis.
- McDonald's, Q3 2026 (company-reported)Systemwide sales up 4%, over $38 billion; defined as sales at all restaurants, whether company-owned or franchised.
- Domino's and Wingstop, Q3 2026 (company-reported)Domino's global retail sales $4,840.4 million, up 3.2% excluding foreign currency; Wingstop system-wide sales $1,437 million, up 6.0%.
- Jack in the Box, Q3 fiscal 2026 (company-reported)Systemwide sales $944.1 million versus $957.8 million, down 1.4%.
System-wide growth can exceed comparable growth when new units open: Wingstop's sales rose 6.0% while its domestic same store sales fell 5.4%. Read the two together to see how much growth is new units and how much is existing restaurants.
Net unit growth and franchised share
For a franchisor the unit count is the growth engine, and net unit growth (openings minus closures) is the KPI that shows whether franchisees are expanding or shrinking.
- Restaurant Brands International, Q3 2026 (company-reported)Net restaurant growth 3.0% to 33,401 restaurants; Burger King (0.9)%, Popeyes 0.0%, Tim Hortons 1.0%.
- Domino's, Q3 2026 (company-reported)Net store growth of 175 (U.S. 26, international 149); 22,706 stores, with 99% franchised.
- Wingstop, Q3 2026 (company-reported)76 net new openings to 3,331 restaurants; 2026 guidance of 440 to 450 global net new units.
- Jack in the Box, Q3 fiscal 2026 (company-reported)4 openings and 17 closures, all franchise, leaving 2,115 restaurants: 1,966 franchise and 149 company-owned.
- McDonald's (company-reported)Approximately 95% of restaurants worldwide are owned and operated by independent local business owners.
Closures matter as much as openings. Jack in the Box attributes part of its fall in franchise margin to fewer restaurants from its closure program. Yum! Brands reported 955 gross new units in the quarter and worldwide unit growth of 7%, but gross openings are not net growth. If you operate franchised units, the equivalent KPIs are net units by market, closures and their cause, and the share of your units that are profitable after rent and royalty.
Digital mix
Digital sales are the one mix KPI that several chains publish, because it also shows who owns the customer relationship.
- Yum! Brands, Q3 2026 (company-reported, excludes Pizza Hut)Digital system sales over $9 billion, a digital mix of 64%.
- Wingstop, Q3 2026 (company-reported)Digital sales were 73.7% of system-wide sales.
- Other chains (company-reported)Not published: the McDonald's, Restaurant Brands, Wendy's and Jack in the Box releases read for this page give no digital sales share.
Digital mix should be tracked beside margin, not instead of it: third-party delivery and app discounts change the profit on each order. A franchisee can measure digital share of sales and of orders, and gross profit per order by channel.
Franchisee profitability, the KPI no one publishes
Franchisor releases report franchisor margins and franchise revenues, which are not the same as what an operator keeps. Franchisee restaurant-level profit appears mainly in a franchise disclosure document or in the operator's own accounts.
- Restaurant Brands International, Q3 2026 (company-reported)Burger King's multi-year Reclaim the Flame plan is described as aimed at accelerating sales growth and driving franchisee profitability, with up to $700 million of investment through year-end 2028 and $198 million funded out of up to $550 million planned for the Royal Reset remodels and equipment. The release gives no franchisee margin figure.
- Jack in the Box, Q3 fiscal 2026 (company-reported, franchisor measure)Franchise-level margin of $60.3 million, or 37.4% of total franchise revenues of $161.4 million, versus $66.2 million, or 39.3%. This is franchise revenue less the franchisor's franchise operating costs, not a franchisee's profit.
- Wendy's, Q2 2026 (company-reported, company-operated restaurants)U.S. company-operated restaurant margin of 13.8% versus 16.2%; the release does not give a franchise operating margin.
The company-operated margins are the nearest public proxy for four-wall profit, but they are for restaurants the franchisor itself runs, not a benchmark for a franchisee. An operator should compute restaurant-level margin (sales less food, labor, occupancy and royalty and advertising fees) for each unit and track it against a fixed target. For a buyer weighing one of these brands, see the Popeyes franchise guide.
Franchisor revenue and the royalty stream
A franchisor is paid on its franchisees' sales, so franchise revenue is the link between unit sales and the corporate income statement.
- McDonald's, Q3 2026 (company-reported)Revenues from franchised restaurants of $4,487 million versus $4,363 million, up 3%.
- Yum! Brands, Q3 2026 (company-reported)Franchise and property revenues of $854 million versus $857 million: KFC $497 million, Taco Bell $245 million, Pizza Hut $109 million.
- Domino's, Q3 2026 (company-reported)U.S. franchise royalties and fees of $165,638 thousand versus $157,155 thousand; international $83,700 thousand versus $78,549 thousand.
- Restaurant Brands International, Q3 2026 (company-reported)Franchise and property revenues of $199 million at Burger King versus $187 million, and $82 million at Popeyes versus $81 million.
Domino's also reports supply chain revenue of $746,154 thousand with a gross margin of 12.2%, a reminder that a franchisor's income can include sales of food and equipment to franchisees as well as royalties. For an operator, the cost side of the same stream is total fees as a percentage of sales: royalty, advertising fund, technology and any required purchases.
Industry size and workforce
Public data describe the size of the limited-service segment but not its franchise economics. NAICS 722513, limited-service restaurants, covers places where customers order and pay before eating, and is separate from full-service restaurants and cafeterias.
- BLS QCEW, NAICS 722513, 2025 (government data, private sector)269,945 average establishments and 4,598,072 average employment, with total annual wages of $111,352,513,602 and average annual pay of $24,217.
- BLS QCEW, NAICS 722513, 2024 (government data)266,696 establishments and 4,624,870 employment, with average annual pay of $23,687.
The data cover all limited-service restaurants, franchised or independent, so they are a backdrop and not a franchise benchmark. They show more establishments with slightly lower employment in 2025, though the series does not state a cause.
What Item 19 does and does not give you
In the United States, the Federal Trade Commission's Franchise Rule is the one place franchisee results can appear in a standard form. Under 16 CFR 436.5(s), Item 19 of a franchise disclosure document covers financial performance representations.
- A franchisor may choose to make none. One that makes no representation must state that it does not make any representations about a franchisee's future financial performance.
- If it makes one, it needs a basis. The franchisor must have a reasonable basis and written substantiation when the representation is made.
- Historic results must show how many reached them. The franchisor must disclose the number and percent of outlets that actually attained or surpassed the stated results.
A scorecard to start with
Putting these together gives a short monthly scorecard for a multi-unit franchise operator.
- Sales. Comparable sales by brand and unit, split into transactions and average check.
- Volume. Trailing twelve-month AUV by unit, market and format, against the brand's published figure where one exists.
- Profit. Restaurant-level margin by unit after royalty and advertising fees, and the share of units above target.
- Growth. Net units, closures and their causes, and development commitments.
- Channels. Digital share of sales and orders, and profit per order by channel.
- Franchisor view. Royalty and fee rate as a share of sales, franchised share of units and franchise-level margin if the brand reports one.
No source read for this page publishes an industry-wide benchmark for franchisee margin, AUV across brands or fee burden, so none is given.
Questions people ask
What are the most important sales KPIs for a QSR franchise operator?
Comparable sales split into traffic and average check, average unit volume, restaurant-level margin after royalty and advertising fees, net unit growth, and digital sales mix, each compared with the brand's own published figures.
What is a good AUV for a quick service franchise?
No industry-wide figure exists in the public sources read for this page. Wingstop reported a domestic AUV of $1,848 thousand for the third quarter of 2026, and most other chains' releases do not publish one, so compare against the franchise disclosure document for your brand.
How much do QSR franchisees earn?
No source read for this page gives an average franchisee profit. Restaurant Brands International says its Burger King plan aims to drive franchisee profitability but gives no margin figure, and Jack in the Box's 37.4% franchise-level margin is the franchisor's measure.
What is Item 19 in a franchise disclosure document?
It is the section where a franchisor may give financial performance representations. If it does, it must have a reasonable basis and written substantiation, and for historic results it must disclose the number and percent of outlets that attained them. If it makes none, it must say so.
How many people work in limited-service restaurants?
BLS QCEW data for NAICS 722513 show 4,598,072 average employment across 269,945 establishments in 2025, with average annual pay of $24,217. The series covers franchised and independent units alike.
Sources
- Restaurant Brands International: Third Quarter 2026 Results, October 29, 2026 (SEC EX-99) · System-wide sales, comparable sales, net restaurant growth, Reclaim the Flame
- McDonald's Corporation: Q3 2026 results (SEC exhibit 99.1) · Comparable sales, systemwide sales, franchised revenues, owner-operator share
- Yum! Brands: Q3 2026 results (SEC exhibit 99.1) · Same-store sales, units, digital mix, franchise and property revenues
- Domino's Pizza: Q3 2026 results, October 13, 2026 (SEC exhibit 99.1) · Same store sales, net store growth, royalties, franchised share
- Wingstop: Q3 2026 results (SEC 8-K exhibit 99.1) · Domestic AUV, same store sales, units, digital mix, guidance
- Jack in the Box: Q3 fiscal 2026 results, August 12, 2026 (SEC 8-K exhibit 99.1) · Same-store sales, franchise-level margin, franchised units
- Wendy's: Q2 2026 results, August 7, 2026 (SEC EX-99) · Same-restaurant sales, net openings, company restaurant margin
- U.S. Bureau of Labor Statistics: QCEW open data, NAICS 722513 · Establishments, employment and pay, 2024 and 2025
- NAICS Association: NAICS 722513 description · Limited-service restaurants definition
- 16 CFR 436.5, Franchise Rule disclosure items (Cornell Legal Information Institute) · Item 19 financial performance representations
Figures were read from the linked pages on November 8, 2026. Company figures are company-reported, and the BLS figures are government statistics. Wendy's results are for the second quarter of 2026, the latest read for that company; Jack in the Box's are for its third fiscal quarter, ended July 5, 2026. The 16 CFR 436.5 text was read through the Cornell Legal Information Institute copy. Where no credible benchmark was found, the page says so instead of estimating. This page is not financial advice.
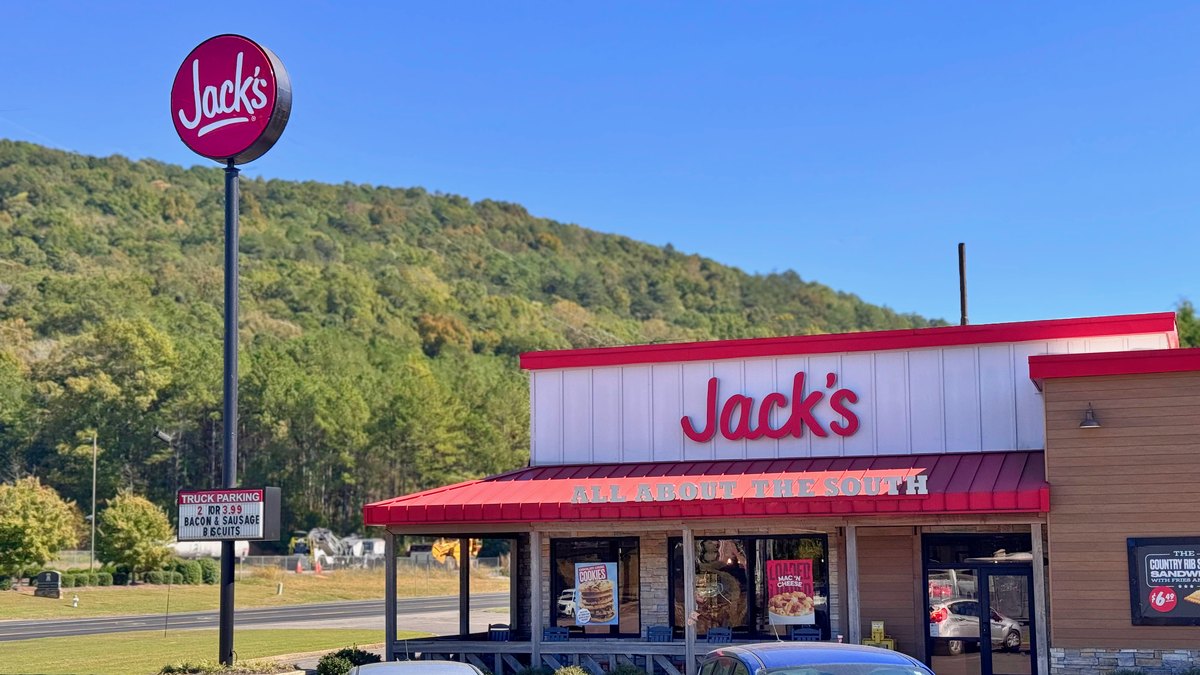
Top photo: Harrison Keely / CC BY 4.0 via Wikimedia Commons