What Are the Key Sales KPIs for the Rideshare and Mobility Marketplaces Industry in 2027?
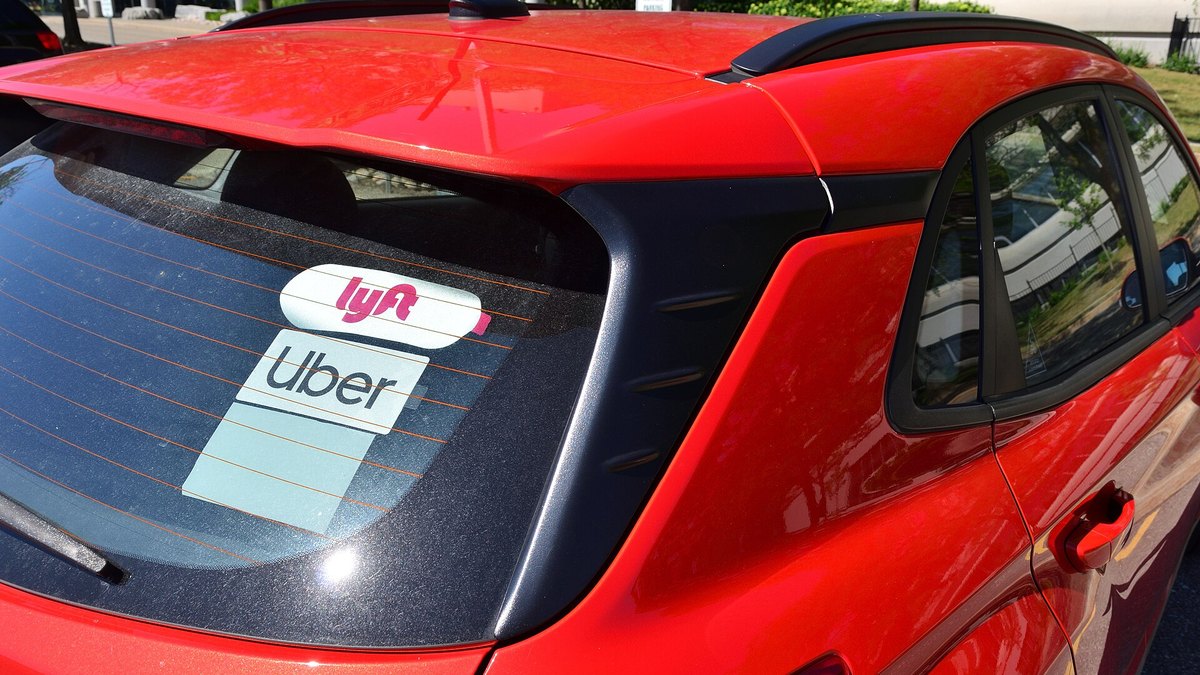
The sales KPIs that matter most for a rideshare or mobility marketplace are gross bookings, trips (or rides), the number of active consumers, how much of gross bookings the company keeps as revenue (its take rate), adjusted EBITDA as a share of gross bookings, driver supply, membership penetration, advertising, and business-account volume. This page uses only figures read in company filings and earnings releases, with the period for each. Uber reported $58.0 billion of gross bookings, 3.9 billion trips and 208 million monthly active platform consumers (MAPCs) for the quarter ended June 30, 2026, and adjusted EBITDA of 4.9% of gross bookings. Lyft reported 30.5 million Active Riders and $5.5 billion of gross bookings for the same quarter, with adjusted EBITDA at 3.2% of gross bookings. Grab reported 53.9 million monthly transacting users and $2.2 billion of Mobility GMV.
Some KPIs are not published as a single number. Neither Uber nor Lyft prints revenue per active rider, driver utilization or a take rate in the releases read here, Lyft gave no Lyft Pink membership count or advertising figure in the sources read, and DiDi's investor pages could not be read, so none of those is estimated. Every source was read on October 31, 2026. This page is not financial advice.
Gross bookings and trips: the scale KPIs
Gross bookings is the total dollar value of transactions on the platform, and trips (Lyft calls them rides) is the count of completed journeys. Together they show whether a marketplace is growing by getting more riders, more rides per rider, or higher prices. Definitions differ, so quote each company's own: Lyft defines Gross Bookings as the total dollar value of transactions including any applicable taxes, tolls and fees, for rides and other offerings, excluding tips to drivers.
- Uber, quarter ended June 30, 2026 (company-reported)Gross Bookings $58,022 million, up 24% (22% constant currency); Mobility Gross Bookings $28,988 million, up 22%; Trips 3,867 million, up 18%.
- Lyft, quarter ended June 30, 2026 (company-reported)Gross Bookings $5,504.2 million, up 23%; Rides 262.4 million, up 12%.
- Grab, quarter ended June 30, 2026 (company-reported)On-Demand GMV $6,463 million, up 21%; Mobility GMV $2,214 million, up 18%.
- Next quarter outlook (company-reported)Uber guides to Gross Bookings of $58.25 billion to $60.25 billion for the third quarter 2026; Lyft guides to approximately $5.50 billion to $5.67 billion.
Lyft's remarks tie part of its gross bookings growth to higher average Gross Bookings per Ride, including the addition of Freenow, which is why bookings (up 23%) grew faster than rides (up 12%). Reading the two together, instead of either alone, shows whether growth is volume or price and mix.
Active consumers and trips per consumer
Active consumers are the demand side of the marketplace. Uber counts Monthly Active Platform Consumers (MAPCs) across its products, so its figure includes delivery customers as well as riders. Lyft counts Active Riders, defined as all unique riders who have taken at least one ride during the quarter, and Grab counts monthly transacting users (MTUs) across rides and deliveries. These three numbers use different definitions, so compare growth rates, not levels.
- Uber. 208 million MAPCs, up 16%, in the quarter ended June 30, 2026. Trips grew 18% on MAPCs growth of 16% and monthly Trips per MAPC growth of 2%.
- Lyft. 30.5 million Active Riders in the same quarter, up 17% from 26.1 million, which the release calls a record.
- Grab. 53.9 million Group MTUs, up 17% from 46.2 million, with On-Demand GMV per MTU of $131, up 3% (Q2 2025: $127).
Uber's split of trip growth into more consumers and more trips per consumer is the cleanest published version of frequency. Grab's GMV per MTU is the closest published figure to spend per active user, and it is on gross merchandise value, not revenue.
Take rate, revenue per rider and the effect of business model changes
Take rate is revenue as a percentage of gross bookings. Uber's 10-Q calls it Revenue Margin and defines it that way, but the releases read here print no percentage, and neither Uber nor Lyft prints revenue per active rider. Because the ratio can move for accounting reasons, read the underlying revenue and bookings together.
- Uber Mobility, quarter ended June 30, 2026 (company-reported)Mobility revenue $7,363 million, up 1% (0% constant currency), against Mobility Gross Bookings up 22%; Uber says business model changes in the UK negatively impacted Mobility revenue by $1.1 billion.
- Uber total, quarter ended June 30, 2026 (company-reported)Revenue $14,191 million, up 12%; business model changes negatively impacted total revenue growth by 8 percentage points.
- Lyft, quarter ended June 30, 2026 (company-reported)Revenue $1,843.5 million, up 16%, against Gross Bookings up 23%.
- Grab Mobility, quarter ended June 30, 2026 (company-reported)Mobility segment revenue $331 million, up 12%, on Mobility GMV up 18%.
The pattern in all four is revenue growing more slowly than bookings, for different reasons. Uber attributes its gap to UK business model changes, and Grab reports incentives of 10.9% of On-Demand GMV, up 72 basis points. A marketplace that reports a falling take rate is not necessarily weakening, so track the stated cause.
Profit as a share of gross bookings
Adjusted EBITDA as a percentage of gross bookings is the marketplace profit KPI that lets different-size companies be compared. One caution on Uber: its release states that adjusted EBITDA is no longer a key measure used by management, though it still prints the figure.
- Uber, quarter ended June 30, 2026 (company-reported)Adjusted EBITDA $2,819 million, up 33%; 4.9% of Gross Bookings, up from 4.5% in the second quarter of 2025. Mobility segment operating income margin 7.6%.
- Lyft, quarter ended June 30, 2026 (company-reported)Adjusted EBITDA $177.2 million, up 37%; margin of 3.2% of Gross Bookings versus 2.9%. Third quarter guidance of approximately 3.3% to 3.6%.
- Grab, quarter ended June 30, 2026 (company-reported)Adjusted EBITDA $168 million, up 54%, or 16.9% of revenue; Mobility Segment Adjusted EBITDA 8.6% of Mobility GMV, down 9 basis points.
The denominators differ: Uber and Lyft use gross bookings, and Grab reports its group figure as a share of revenue and its segment figures as a share of GMV. Compare like with like only.
Driver supply and utilization
A marketplace needs enough drivers to keep wait times low, so supply is a sales KPI as much as an operations one. The disclosures are thin. Uber said in its Q2 2026 remarks that a record 10.2 million drivers and couriers earned over $25 billion on the platform in the quarter, and Grab reported that average monthly active driver-partners grew 19% year over year to an all-time high. Uber also noted that suburban and sparser markets grew about 1.5 times faster than denser markets while generating higher margins.
Utilization (the share of driver time with a passenger) is not published in any filing read for this page. Uber does say that utilization of autonomous vehicles is sensitive to demand peaks and troughs. Lyft's sources read give no driver count or hours, so for your own marketplace track active drivers, hours online, acceptance and the share of requests filled.

Membership, advertising and business accounts
The newer revenue KPIs sit outside the core ride. Uber discloses the most.
- Membership. Uber reported 50 million Uber One members in its first quarter 2026 release of May 6, 2026, with members driving half of Gross Bookings across Mobility and Delivery. In the second quarter 2026 remarks, members accounted for more than 70% of Delivery Gross Bookings. No Lyft Pink member count appears in the Lyft sources read.
- Advertising. Uber said advertising exceeded a $2.5 billion annualized revenue run-rate in the second quarter 2026, still growing roughly 50% year over year. Grab gave no advertising revenue but said total quarterly active advertisers on its self-serve platform grew 21% and average advertiser spend grew 24%. Lyft's 10-Q says it earns revenue from advertising services but prints no figure.
- Business accounts. Uber said Uber for Business (U4B) Gross Bookings grew 40%+ year over year in the second quarter 2026, with business customers choosing premium experiences that generate nearly 2x the Gross Bookings and 4x the contribution profit per trip compared to UberX across its largest markets. Lyft's 10-Q says it offers Lyft Business programs such as Concierge and Lyft Pass but prints no figure.
- Partnerships. Lyft said approximately 30% of North American rideshare rides were linked to a partnership in the second quarter 2026, an all-time high.
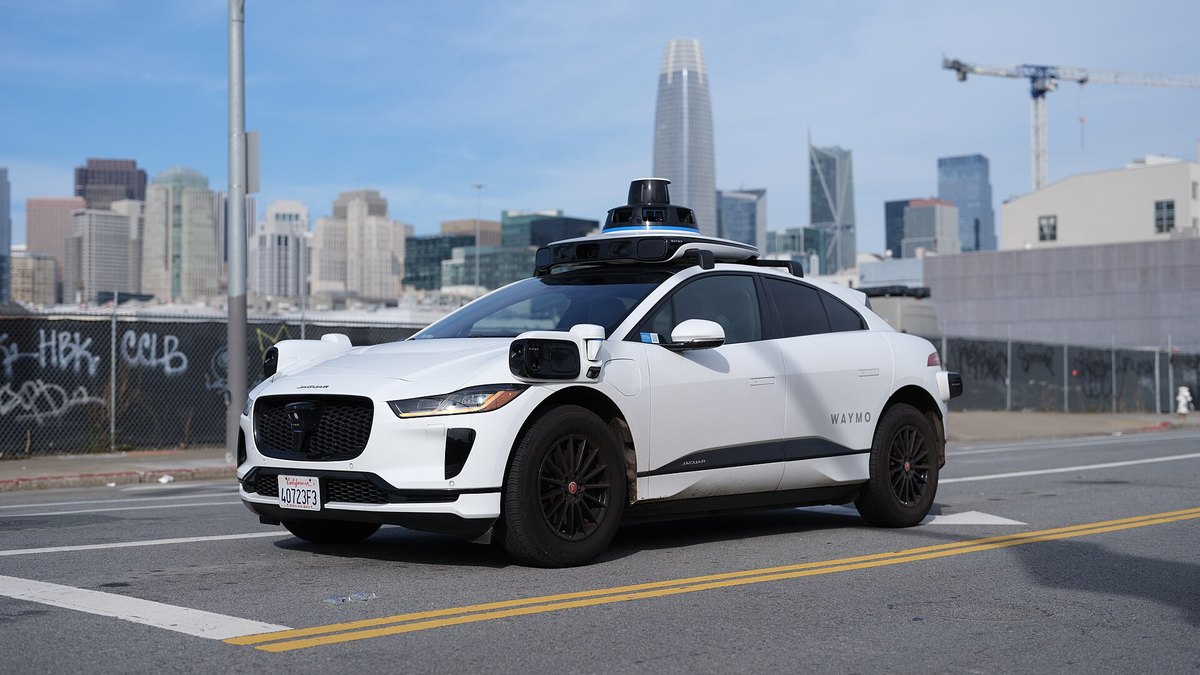
Autonomous vehicles are the open question for every KPI above. Uber's remarks describe building the commercialization layer for autonomous partners, and Lyft said its fleet operations with Waymo in Nashville began in June 2026. Neither release gives autonomous trip or revenue figures that this page can quote.
A scorecard to start with
Read together, the filings point to a short weekly or monthly scorecard.
- Scale. Gross bookings and trips, with constant currency growth.
- Demand. Active consumers and trips per consumer, by city and by product.
- Monetization. Revenue as a share of gross bookings, with incentives and one-time accounting changes shown separately.
- Profit. Adjusted EBITDA as a share of gross bookings.
- Supply. Active drivers, hours online and requests filled.
- Loyalty. Member share of bookings and member trip frequency.
- New revenue. Advertising run-rate and business account bookings.
Questions people ask
What are the most important sales KPIs for a rideshare marketplace?
Gross bookings, trips, active consumers, take rate (revenue as a share of gross bookings), adjusted EBITDA as a share of gross bookings, driver supply, membership penetration, advertising and business-account bookings. Company releases cover the first four well and the rest only in part.
How big are Uber and Lyft by gross bookings?
For the quarter ended June 30, 2026, Uber reported $58.0 billion of gross bookings (up 24%) and Lyft reported $5.5 billion (up 23%).
What is a good adjusted EBITDA margin for a rideshare company?
Company-reported figures for the quarter ended June 30, 2026 were 4.9% of gross bookings at Uber and 3.2% at Lyft, with Lyft guiding to approximately 3.3% to 3.6% for the third quarter. Grab reports its group figure as 16.9% of revenue, which is a different denominator.
How many people use Uber, Lyft and Grab each month or quarter?
Uber reported 208 million MAPCs, Lyft 30.5 million Active Riders for the quarter and Grab 53.9 million monthly transacting users, all for the quarter ended June 30, 2026. Definitions differ across the three.
Is there a published benchmark for take rate, revenue per rider or driver utilization?
Not in any source read for this page. Uber defines Revenue Margin but prints no percentage in the releases read, and no source read publishes revenue per active rider or utilization.
Sources
- Uber Technologies: Q2 2026 results (SEC 8-K exhibit), August 5, 2026 · Gross bookings, trips, MAPCs, revenue, adjusted EBITDA
- Uber Technologies: Form 10-Q for the quarter ended June 30, 2026 · Revenue Margin definition, UK business model change effect on Mobility revenue
- Uber Technologies: Q2 2026 prepared remarks, August 5, 2026 · Drivers, Uber One, advertising run-rate, Uber for Business
- Uber Technologies: Q1 2026 results (SEC 8-K exhibit), May 6, 2026 · Uber One member count
- Lyft: Q2 2026 results (SEC 8-K exhibit), August 6, 2026 · Active riders, rides, gross bookings, revenue, adjusted EBITDA, outlook
- Lyft: Form 10-Q for the quarter ended June 30, 2026 · Metric definitions, Lyft Business and advertising revenue lines
- Lyft: Q2 2026 earnings prepared remarks, August 6, 2026 · Gross bookings per ride, Freenow, Waymo Nashville, partnerships
- Grab Holdings: Q2 2026 results (SEC Form 6-K exhibit), August 4, 2026 · MTUs, GMV, Mobility segment, incentives, advertisers, driver-partners
Figures were read from the linked pages on October 31, 2026. All figures are company-reported; no vendor or analyst benchmark is used. Where no figure was published, the page says so instead of estimating. DiDi, Bolt and BlaBlaCar are not quoted because no official page with current figures could be read. Photos: Wikimedia Commons, credited on the page. This page is not financial advice.
Top photo: Raysonho @ Open Grid Scheduler / Scalable Grid Engine / CC0 via Wikimedia Commons