GTM Playbook for AgTech Companies in 2027
An agtech company should go to market one crop, one region and one farm-size band at a time, prove return on investment per acre in on-farm trials, and sell through the channels farmers already trust: ag retailers, cooperatives, equipment dealers and agronomists or certified crop advisers. Time every sale to the crop calendar and to the farmer's budget and financing cycle, and expect adoption to spread by word of mouth from neighbors who saw the trial plot.
The public data supports that shape. In the 2022 Census of Agriculture, USDA NASS counted 1.9 million farms with an average size of 463 acres, and 74% of them had sales of $50,000 or less. USDA's Economic Research Service found that adoption of precision tools is uneven: less than 25 percent of smaller row crop farms (first quintile by acreage) use any of four core technologies, while at least half of the largest do. A go-to-market plan that treats all farms as one market will miss.
The sections below give the facts behind each move, say where no public figure exists, and end with metrics to track. Pricing benchmarks are the weakest area: I found no published per-acre or subscription price data, so that section gives a method instead of numbers.
The market: how many farms, how big, how digital
Start with the official counts. These are from the 2022 Census of Agriculture, released by USDA NASS in February 2024, the most recent census available.
- Farms and ranches, 2022 (USDA NASS)1.9 million (exactly 1,900,487), down 7% from 2017
- Land in farms880 million acres, 39% of all U.S. land
- Average farm size463 acres, up 5%
- Farms with sales of $1 million or more105,384 farms: 6% of farms and 31% of farmland
- Farms with sales of $50,000 or less1.4 million farms: 74% of farms, 25% of farmland, 2% of sales
- Farms with internet access79% in 2022, up from 75% in 2017
Read the table as a targeting tool. A small share of farms holds a large share of the land and the sales, which is where a paid, per-acre product has the most acres to act on. The long tail of small farms is a very different sale, with a different budget and different needs. The census release says it added new questions on precision agriculture in 2022, but the release gives no national figure for it, so this page does not quote one.
Pick a wedge: crop, region and farm size
USDA's Economic Research Service studied adoption of soil maps, yield maps, yield monitors, variable rate technology, auto-steer and guidance, and aerial imagery across six crops: corn, cotton, rice, sorghum, soybeans and winter wheat. The February 2023 report summary (McFadden, Njuki and Griffin) is the clearest public view of who has already bought.
- Guidance and auto-steer are mainstream. Auto-steer guidance was on only 5.3 percent of planted corn acres in 2001 and 58 percent in 2016. ERS puts adoption at 58.4 percent of corn acres in 2016, 55.9 percent for winter wheat in 2017, 54.5 percent for soybeans in 2018 and 64.5 percent for cotton in 2019. Estimates for 2019 suggested 72.9 percent for sorghum. If your product competes with a tool that most acres already have, you are selling a replacement, not a new category.
- Farm size splits the market. At least half of relatively large row crop farms (at or above the third quintile of acreage) rely on yield maps, soil maps, variable rate technology or guidance. Except for cotton, less than 25 percent of smaller farms (first quintile) use any of those four. ERS says this could be due to scale benefits, meaning returns to the technology may be greater on larger farms.
- Crop changes the use case. ERS found corn and winter wheat farmers tend to use yield monitors to track crop moisture content, while in cotton, soybeans and sorghum they are mainly used to help determine chemical input use. The same hardware is bought for different jobs, so the message differs by crop.
- Adoption depends on field conditions. ERS names field topography and soil type, adjustment costs such as subscription fees, training, maintenance and replacement, and farmers' production scale and risk preferences.
The buying calendar: season first, budget second
Farm purchases follow the crop calendar. The USDA NASS handbook on usual planting and harvesting dates (October 2010, the latest edition I could find) defines the beginning of planting or harvest as about 5 percent complete and the end as about 95 percent complete, with a most active window between 15 and 85 percent. The dates come from 20 years of crop progress estimates and industry specialists, and they differ by state. Iowa is a useful example:
- Iowa corn for grain, plantingBegins Apr 19; most active Apr 25 - May 18; ends May 26
- Iowa corn for grain, harvestBegins Sep 21; most active Oct 5 - Nov 9; ends Nov 21
- Iowa soybeans, plantingBegins May 2; most active May 8 - Jun 2; ends Jun 16
- Iowa soybeans, harvestBegins Sep 21; most active Sep 28 - Oct 20; ends Oct 31
- Iowa winter wheat, plantingBegins Sep 6; most active Sep 26 - Oct 15
Three consequences follow. First, a product that has to be in the ground, on the planter or in the sprayer cannot be sold during its use window, so the decision happens before it, and the proof has to be ready earlier. Second, the most active planting and harvest windows are when farmers will not take a sales meeting. Third, the calendar is different for every crop and state, so a multi-crop launch needs a separate calendar for each.
I did not find a USDA source for when farmers do their buying and attend winter meetings, so treat the usual pattern of buying between harvest and planting as something to confirm with your own pilot customers and channel partners.
Budget and financing matter as much as timing. The Federal Reserve Bank of Kansas City's Agricultural Credit Survey, whose August 14, 2026 update was headlined as a steady tightening of agricultural credit conditions, said the level of financial stress was modest in the second quarter of 2026. The survey tracks operating, machinery and real estate loan rates, which is the cost of money behind any equipment or subscription purchase. A Missouri survey (2022, preliminary) gave lack of capital as the top reason for not adopting precision tools at 32%. Plan the offer around cash flow: trial first, pay after harvest or in step with a farmer's existing input bill where you can.
Prove ROI per acre: on-farm trials and extension
Farmers adopt what they have seen work on a farm like theirs. A 2024 study in Agronomy Journal by Pires and colleagues surveyed farmers across much of the US Midwest and South-Central regions with a 24-question survey. It found farmers were generally willing to work with universities on on-farm research and were 40% more likely to adopt practices supported by on-farm research findings than practices backed by research not conducted on farms.
- Run side-by-side strips. A treated strip against an untreated or standard-practice strip in the same field is the format a farmer understands. Define the measure in advance: yield, input cost saved, labor hours or passes, converted to dollars per acre.
- Use a neutral party. University and extension partners add credibility that a company's own numbers cannot, and the 2024 study suggests the on-farm location matters as well.
- Publish the method and the misses. State the field conditions, the crop, the year, and the cases where the result was small. Agronomists will read it for what it does not say.
- Match the trial to the buying calendar. A trial that reports after the buying decision does nothing. Work backward from the date the farmer decides.
- Know the limit. I found no public figure for the share of farmers who require a trial before buying, so do not claim one. Ask your pilot accounts.
Channels: ag retailers, cooperatives, dealers and agronomists
The channels that farmers already use for inputs and advice are a faster path to trust than a new brand can build alone. The best public evidence is a small one. In preliminary results from a Missouri survey presented at the 2022 ASABE Annual International Meeting, farmers named these as their main information sources on precision agriculture technology:
- Agricultural retailers40%
- Extension agents25%
- Customer service providers and crop consultantsalmost 20%
- Other innovative producers15%
That is one state and preliminary, and the page gives no sample size, so use it as direction, not a national statistic. It lines up with the ERS finding that technology adopters are more likely to use technical and consultant services than nonadopters, though ERS also notes such services are hired on a small fraction of surveyed acres.
- Ag retailers. They sell inputs and often provide advice and application services. A retailer that adds your product needs margin, training and a reason to put it in front of its customers. I could not retrieve a current USDA or trade figure for ag retail revenue, so this page does not size it.
- Cooperatives. USDA Rural Development publishes annual Agricultural Cooperative Statistics reports with counts of marketing, supply and service co-ops and their business volume; use the latest edition for current numbers. A supply cooperative is a concentrated route to many member farms, and a merged cooperative is fewer decisions.
- Agronomists and certified crop advisers. The Certified Crop Adviser program, run through Science Societies, certifies agronomists through testing and ongoing training, with certification maintained through continuing education units and local boards reviewing credentials. Advisers who recommend products to growers are a credibility channel, and their ongoing education requirement is a natural home for training material. I found no published count.
- Equipment dealers. Dealers matter where your product is hardware or has to integrate with a machine. I found no public figure on dealer share or counts, so verify this channel with your own research in your region.
Data and connectivity barriers
A product that needs a connection in the field or an upload from the cab only works if the signal is there. The Census of Agriculture found 79% of farms had internet access in 2022, up from 75% in 2017. That is access of some kind, and it says nothing about speed or reliability in the field.
The FCC's 2024 broadband report, adopted March 14, 2024, uses data as of December 2022 and sets the benchmark for fixed broadband at 100 Mbps down and 20 Mbps up, up from 25/3 Mbps. It found fixed terrestrial service (excluding satellite) had not been physically deployed to approximately 24 million Americans, including almost 28% of Americans in rural areas. For mobile, 5G at 35/3 Mbps had not been deployed to almost 36% of Americans in rural areas. Two commissioners dissented from the report. These are measures of people in rural areas, not farms, and the figures are older than this page.
- Design for offline. Capture data in the field without a connection and sync when the device reaches a signal at the shop or home.
- Ask about coverage before the pilot. Check connectivity on the pilot fields as part of qualification.
- Respect data worries. State who owns the data and who can see it. I found no USDA figure on farmer data-ownership concerns, so keep that statement in your own contract language and not as a statistic.
Pricing models: what is and is not published
I found no public benchmark for per-acre, subscription or outcome-based pricing in agtech, so this page gives no price points. What sources do say is that adjustment costs such as subscription fees, training, maintenance and replacement shape adoption (USDA ERS), and that lack of capital was the leading reason for not adopting in the Missouri survey at 32%, with not cost-effective for small operations next at 20%.
- Per acre. Matches how farmers think about input costs and aligns with ROI per acre. It also makes the pitch checkable against the trial.
- Subscription. Works for software and data services where value repeats each season. Expect resistance if the first season's proof comes after the bill.
- Outcome or shared savings. Aligns incentives but needs trusted measurement, which is another reason for neutral trials.
- Hardware plus service. Financing and dealer terms matter most here, and the credit conditions above set the price of that money.
Funding context: what investors are backing
Funding affects how long a company can stay in a slow sales cycle. AgFunder's Global AgriFoodTech Investment Report 2026, which covers 2025, found global agrifoodtech funding of $16.2 billion, almost flat versus the prior year (down 3%). Upstream companies, those building technology for farms and food production, drew $9 billion, up 7%, even as deal count fell 12%. Coverage of the report says debt reached 18.2% of total funding, the highest share in a decade, and that all agrifoodtech funding is around 70% below 2021.
AgFunder is an agrifood investor, so treat its research as an informed but interested view. The practical point is that capital is selective, which is another reason to show field evidence and repeatable sales before raising.
Metrics to track
No public source I found publishes agtech benchmarks for these, so use the formulas, tracked by crop and region.
- Trial-to-paid conversionTrials completed that became paying customers, divided by trials completed
- ROI per acre in trialsDollar benefit per acre minus your cost per acre, by crop and field condition
- Channel-sourced revenueRevenue by retailer, cooperative, dealer or adviser that introduced the account
- Sales cycle by seasonDays from first contact to signed order, compared against the crop calendar
- Acres under contract and retainedAcres enrolled this season and share that renewed next season
- Referral rateNew accounts that name an existing customer or neighbor as the source
Questions people ask
How should an agtech company go to market?
Choose one crop, region and farm-size band, prove ROI per acre in on-farm trials, and sell through ag retailers, cooperatives, dealers and agronomists. Time the sale to the crop calendar and the farmer's financing cycle. A 2024 Agronomy Journal study found farmers were 40% more likely to adopt practices supported by on-farm research.
How many farms are there in the United States?
The 2022 Census of Agriculture counted 1.9 million farms and ranches on 880 million acres, with an average size of 463 acres, according to USDA NASS.
How widely is precision agriculture used?
It depends on the technology, crop and farm size. USDA ERS reports auto-steer or guidance on 58.4 percent of corn acres in 2016 and over 50 percent of planted acres for four crops by 2019. Less than 25 percent of smaller row crop farms use any of four core technologies.
Who do farmers get technology advice from?
In a preliminary 2022 Missouri survey, agricultural retailers were named by 40%, extension agents by 25%, and customer service providers and crop consultants by almost 20%. It is one state, so use it as direction.
Does rural broadband limit agtech?
It can. The FCC reported that fixed terrestrial broadband at 100/20 Mbps was not deployed to almost 28% of Americans in rural areas as of December 2022. Design products to work offline.
Sources
- USDA NASS: 2022 Census of Agriculture release · Farm counts, size, sales classes, internet access
- USDA ERS: Precision Agriculture in the Digital Era (summary) · Adoption by technology, crop and farm size, February 2023
- USDA ERS Charts of Note: auto-steer and guidance · Auto-steer adoption by crop, March 2023
- USDA NASS: Usual Planting and Harvesting Dates, October 2010 · Planting and harvest windows by state
- Pires et al., Agronomy Journal, 2024 · Farmer perspective on on-farm research
- Precision agriculture adoption in Missouri farms (ASABE 2022) · Information sources and barriers, preliminary
- Science Societies: Certified Crop Adviser · CCA program description
- USDA Rural Development: Agricultural Cooperative Statistics 2019 · Cooperative counts and business volume
- FCC: broadband speed benchmark press release, March 2024 · Rural broadband deployment gaps
- AgFunder Global AgriFoodTech Investment Report 2026 · 2025 funding totals
- Global Ag Investing: lessons from the 2026 AgFunder report · Debt share and context
- Kansas City Fed: Agricultural Credit Survey · Farm credit conditions, August 2026
Figures were read from the linked pages on October 20, 2026. Weak spots: the Missouri survey is preliminary and one state, the cooperative counts come from a summary of the USDA report, the planting dates are from a 2010 handbook, the FCC data is as of December 2022 and counts people rather than farms, and no public benchmark was found for pricing, equipment dealers or ag retail size. Use these as direction and confirm with your own pilots.
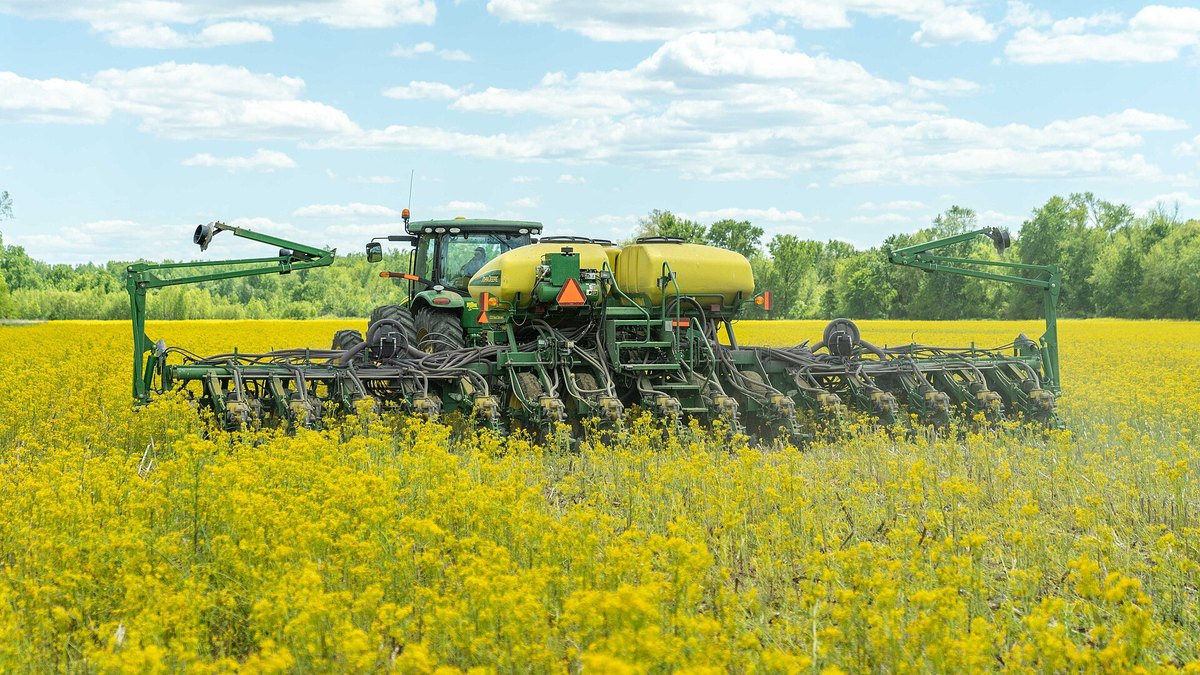
Top photo: Indiana NRCS / USDA (Brandon O'Connor), public domain via Wikimedia Commons