How Do I Budget a Data Center or Colocation Buildout in 2027?
Budget a buildout in three layers: the construction or lease cost for the capacity you need, the power and land that make that capacity usable, and a contingency for delay and price drift. The best published anchors are per-megawatt and per-kilowatt, not per-square-foot. Cushman & Wakefield puts average all-in greenfield cost at $17.6 million per MW for the most modern facilities, excluding chips and GPUs. If you lease instead, CBRE reports a national average asking rent of $194.95 per kW per month.
Those two numbers answer different questions. Building ties up capital and years; leasing turns the cost into a monthly rate but, per CBRE, vacancy is at a record low 1.4% and grid power for existing projects is largely booked through 2030 in most markets. So the real budget risk is not only price, it is whether the capacity exists when you need it.
Published figures are averages for large facilities. None of the sources read here gives a cost for a small enterprise build or retail per-rack colocation pricing, so those must come from quotes. This page is not financial or engineering advice; get bids from builders and providers before you commit.
Decide first: build, lease or both
The two paths are budgeted in different units. A build is a capital number per MW of critical load. A lease is a recurring number per kW per month. Compare them on the same capacity and the same timeline, and include what each leaves out.
- Build. You carry land, power infrastructure, construction and contingency, as laid out in the Cushman & Wakefield guide, and you wait out construction and utility timelines.
- Lease (colocation). You pay an asking rent per kW per month, as tracked by CBRE, and compete for scarce space.
- Hybrid. Lease for near-term capacity while a build is delivered. This is a planning approach, not a cost claim from the sources.
What building costs per MW and per watt
Two respected cost studies use different bases, so do not mix them in one spreadsheet column.
- Cushman & Wakefield, all-in greenfield, U.S. and Canada$17.6 million per MW for the most modern facilities, excluding chips and GPUs
- Cushman & Wakefield, change in construction costUp an average of 21% per MW since the fourth quarter of 2024
- Turner & Townsend, U.S. country averageUS$12.08 per watt, indicative, based on a typical 60MW design
- Turner & Townsend, change in cost per wattAverage up 13% year on year, with the sharpest rises in North American and European markets
The Cushman & Wakefield release of September 3, 2026 says Texas markets continue to rank among the lowest-cost development environments, but it gives averages only, with no low-to-high range, and does not itemize what "all-in" covers. The Turner & Townsend index, dated 22 Oct 26, draws on over 500 live or recent projects across 62 markets. Tokyo is at US$18.28 per watt in that index, so location moves the number a lot.
The sources do not reconcile the two series, and this page does not convert between them. Pick one for your region and ask each bidder what its price includes.
What leasing costs per kW per month
CBRE reports a national average asking rent of $194.95 per kW per month, up 6.5% year over year, with vacancy at a historic low of 1.4%. In its H2 2025 trends report, CBRE gives a record $196.25 per kW per month for 250-500 kW requirements in primary wholesale colocation markets, up 6.6%, and says pricing for 3-to-10-MW requirements rose 12.5% year over year.
Markets differ. CBRE's Global Data Center Trends 2026 says Chicago led North America in Q1 2026 at $200 to $230 per kW per month for 250-to-500-kW requirements, and that Northern Virginia was the tightest market, with vacancy at 0.3%.
Power and land are the budget swing factors
The Cushman & Wakefield release says power infrastructure is the single largest cost category, at about 21% of greenfield costs, with contingencies second. It reports powered land in primary U.S. markets averaging $584,000 per MW in 2026 year-to-date, 35% above its five-year average and 51% higher year-over-year.
Timing matters as much as price. CBRE says grid-power capacity for existing projects is largely booked through 2030 in most markets, and that greenfield sites with power access within 18 to 36 months are highly sought after. In Chicago, CBRE says ComEd power-delivery timelines remain extended into 2032 or later. A site with cheap land but no near-term power is not a cheap site.
Density and AI add cost
Turner & Townsend says U.S. data centres built to handle AI workloads cost around 10% more than traditional facilities, and that the most advanced AI-specific facilities are seeing rates between US$14.00 and US$16.00 per watt. It names higher rack density, liquid cooling requirements and accelerated delivery schedules as the primary drivers.
Most operators are not there yet. The Uptime Institute 2025 survey says average rack power is climbing slowly, mainly because more operators use racks in the 10-30 kW band, and that few facilities exceed 30 kW. Decide your real density before you pay for a design you will not use.
Build the budget line by line
Use published benchmarks only to sanity-check your own quotes. A workable structure:
- Capacity. Critical load in kW or MW, now and in the next phase.
- Site and power. Land, utility interconnection and the date power is actually delivered.
- Construction or rent. Per-MW build bids, or per-kW monthly rent with the term and escalators in the contract.
- Cooling and density. Match design to the racks you will really run.
- Contingency. Cushman & Wakefield ranks contingencies as the second-largest category, citing material lead times, labor shortages and regulation. See the release.
- Delay cost. What it costs the business if capacity arrives a year late.
Rising costs are the norm in these sources: construction cost per MW up 21% since the fourth quarter of 2024 per Cushman & Wakefield, and cost per watt up 13% year on year per Turner & Townsend. Uptime reports cost issues remain the top concern for management teams in 2025, and that forecasting future capacity has become a growing worry. Revisit the budget each quarter.
Questions people ask
How much does it cost to build a data center per MW?
Cushman & Wakefield puts average all-in greenfield cost at $17.6 million per MW for the most modern facilities, excluding chips and GPUs. Costs vary by market and workload, and the figure is an average, not a quote.
What does colocation cost per kW per month?
CBRE reports a national average asking rent of $194.95 per kW per month. For 250-500 kW in primary wholesale markets, its H2 2025 report gives $196.25. Retail per-rack pricing is not published in these sources.
Is building or leasing cheaper?
The sources read here do not publish a break-even point. Compare real quotes on the same capacity and timeline, including power delivery dates and contingency.
Why does powered land matter so much?
The Cushman & Wakefield release reports powered land in primary U.S. markets averaged $584,000 per MW in 2026 year-to-date, and calls power infrastructure the single largest cost category.
How much more do AI data centers cost?
Turner & Townsend says U.S. data centres built for AI workloads cost around 10% more than traditional facilities.
Sources
- Cushman & Wakefield: Data Center Development Cost Guide · Average greenfield cost per MW
- Cushman & Wakefield 2026 guide release (Business Wire via Stock Titan) · Cost change, powered land, cost categories
- Turner & Townsend: Data centre construction cost index 2026-27 · Cost per watt, AI premium
- CBRE: North American data center market set records in 2025 · National asking rent, vacancy, capacity
- CBRE: North America Data Center Trends H2 2025 · Wholesale rates, power availability
- CBRE: Global Data Center Trends 2026 · Chicago and Northern Virginia market data
- Uptime Institute: Global Data Center Survey 2025 · Rack density and cost concerns
Figures were read from the linked pages on November 4, 2026. They are averages or asking rates for large facilities and change often. This is not financial or engineering advice.
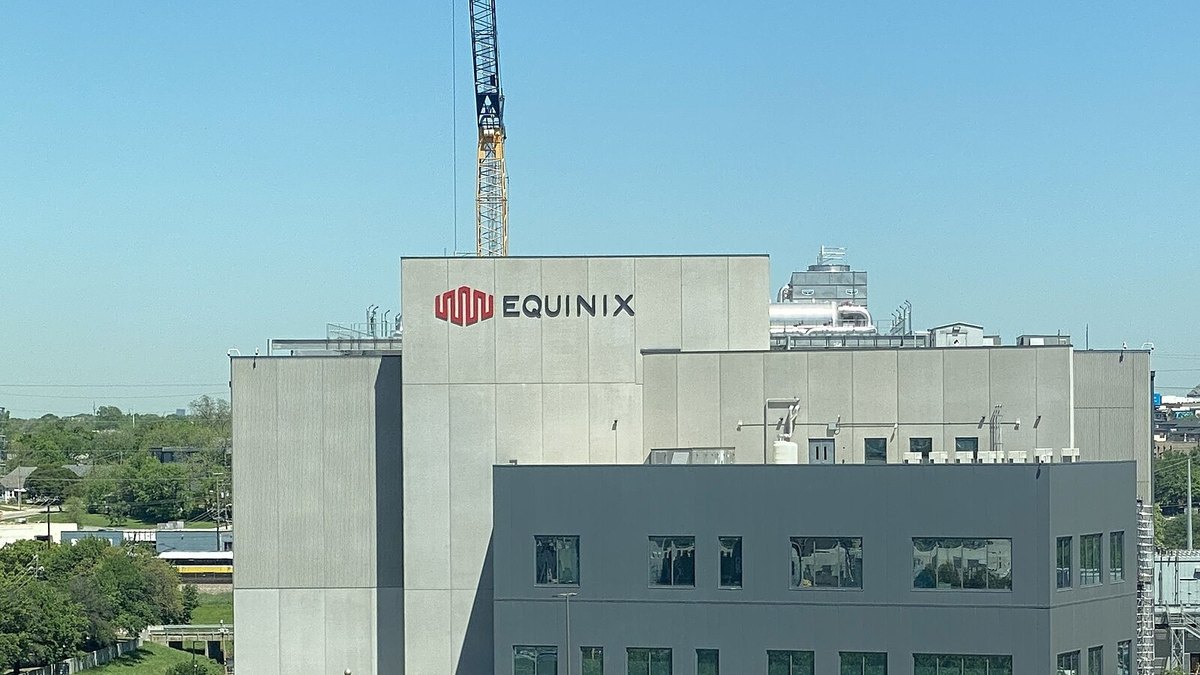
Top photo: Andrew nyr / CC BY-SA 4.0 via Wikimedia Commons