What's a good LTV:CAC ratio, and why does it lie to most B2B SaaS founders in 2027?
Most sources put a good LTV:CAC ratio at 3 or higher, but the ratio is only as honest as its churn and margin assumptions. David Skok says the best SaaS businesses are above 3, and Bessemer (September 21, 2021) recommends investing in acquisition at 3x or more. Both are guidelines from investors, not findings from a dataset, and I found no primary study behind the 3.
It misleads because LTV divides by churn: in one agency's illustrative example, the same business shows 5.3:1 at 1.5% monthly churn and 2:1 at 4%, while payback stays at 12.5 months. Check CAC payback, which the Aleph and Benchmarkit 2026 report puts at a median of 16 months, and read LTV:CAC by cohort.
The formula, and where the 3 comes from
LTV is the revenue or profit a customer brings over their life, and CAC is what it cost to win them. The ratio is LTV divided by CAC. Skok's definitions page sets customer lifetime as 1 divided by churn (for example, 1/0.03 = 33 months at 3% monthly churn), and says his "above 3" guideline assumes the simple LTV formula and gross margin of 80% or higher.
Skok's SaaS Metrics 2.0 (no date shown on the page) says "The best SaaS businesses have a LTV to CAC ratio that is higher than 3," that some reach 7 or 8x, and that "these are only guidelines." He also notes that many healthy SaaS businesses do not meet them early on. Bessemer's Atlas says "We recommend investing in customer acquisition when CLTV / CACs are 3x+." Neither gives a sample behind the number, which is why I call it a rule of thumb.
Five ways the ratio misleads
- Assumed churn. LTV sits on a lifetime forecast. SaaS Hero (a marketing agency, published October 6, 2026) says a 1 percentage point rise in monthly churn "typically destroys 20% to 40% of calculated LTV." Skok warns that entrepreneurs are usually overoptimistic about acquisition costs.
- Revenue instead of margin. Bessemer defines CLTV as "the gross margin-affected value of a customer." a16z (August 21, 2015) goes further and defines LTV on net profit, not revenue or gross margin. A revenue-based LTV flatters the ratio.
- Blended instead of paid CAC. a16z says paid CAC is "more important than blended CAC in evaluating the viability of a business," because blended CAC does not show whether paid campaigns are profitable.
- Young cohorts. a16z suggests that with little data you measure 12-month and 24-month LTV rather than extrapolating a lifetime. A ratio built on a few months of retention is a guess.
- It hides slow payback. The ratio says nothing about when cash comes back. Skok says profitability is "anemic" if the time to recover CAC extends beyond 12 months.
A hypothetical example
The numbers below are SaaS Hero's illustrative example, not real company data. Take CAC of $2,000, monthly revenue per account of $200, gross margin of 80% and monthly churn of 1.5%. Monthly gross profit is $160, CAC payback is 12.5 months, LTV is $10,667 and LTV:CAC is 5.3:1.
Change only churn to 4%, a figure the article calls a common SMB assumption: LTV falls to $4,000 and LTV:CAC to 2:1, while payback is still 12.5 months. The same acquisition economics clear the 3 bar or fail it depending on one assumption.
What to check alongside it
CAC payback uses inputs you can observe now. Bessemer's targets are under 12 months for SMB, under 18 for mid-market and under 24 for enterprise, and it reports an average of 15 months in the $1-10MM ARR bucket. The Aleph and Benchmarkit report (June 1, 2026, CY-2025 data, 342 companies, 198 reporting payback) puts the median at 16 months and the top quartile at 6 months or fewer. Aleph is a software vendor, so treat the report as vendor-published.
SaaS Hero says payback governs when cash is the binding constraint and LTV:CAC when durability is, and that payback ignores value after breakeven and expansion revenue, so neither stands alone.
For efficiency across the whole company, the burn multiple is net burn divided by net new ARR over the same period, introduced by David Sacks of Craft Ventures in an April 2020 post, according to a Rework glossary page. Burning $2M in a quarter while adding $1M of net new ARR is a 2x multiple, and lower is better. Pages I found disagree on the rating bands, so I give none.
What I could not verify
So what is a good ratio?
- Treat 3 as a floor to test, not a target. It assumes margin of 80% or higher and a believable churn rate, per Skok.
- Pair it with payback. Compare yours to the segment targets of 12, 18 and 24 months from Bessemer.
- Use margin-based LTV, paid CAC and cohorts. These are the adjustments a16z and Bessemer point to.
- For 2027: no source I read forecasts a change to the 3 guideline.
Questions people ask
What is a good LTV:CAC ratio?
Skok says the best SaaS businesses are higher than 3, and Bessemer recommends investing in acquisition at 3x or more. Both are guidelines, not survey medians.
Where does the 3:1 benchmark come from?
It appears in David Skok's SaaS Metrics 2.0 and in Bessemer Atlas (September 21, 2021). I found no primary dataset behind it.
Why can LTV:CAC mislead?
LTV depends on an assumed churn and lifetime. In SaaS Hero's hypothetical, changing monthly churn from 1.5% to 4% moves the ratio from 5.3:1 to 2:1 with payback unchanged at 12.5 months.
Should LTV use revenue or gross margin?
Bessemer defines CLTV as gross-margin-affected. a16z defines LTV on net profit rather than revenue or gross margin.
What is a good CAC payback period?
Bessemer targets under 12 months for SMB, under 18 for mid-market and under 24 for enterprise. Aleph and Benchmarkit report a 16-month median for CY-2025.
Sources
- David Skok, SaaS Metrics 2.0 (For Entrepreneurs, undated) · Above-3 guideline, 12-month payback, churn warning
- David Skok, SaaS Metrics 2.0 definitions · Lifetime = 1/churn; 3 assumes 80%+ gross margin
- Bessemer Atlas: Scaling to $100 Million (September 21, 2021) · 3x CLTV/CAC, gross-margin CLTV, payback targets
- a16z: 16 Startup Metrics (August 21, 2015) · Net-profit LTV, paid vs blended CAC
- Aleph and Benchmarkit 2026 SaaS benchmarks (June 1, 2026; vendor) · Median 16-month CAC payback, sample
- SaaS Hero: CAC Payback vs LTV:CAC (October 2026; agency) · Illustrative churn example
- Rework glossary: Burn multiple (undated) · Burn multiple formula
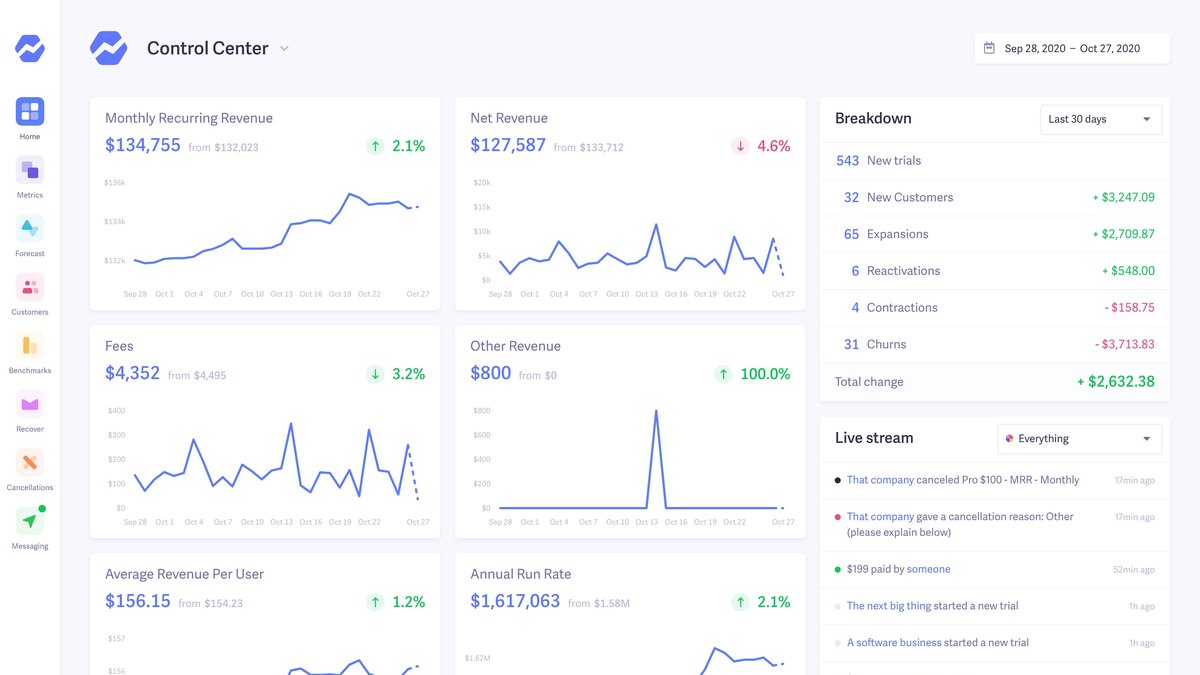
- Baremetrics features page · Page image: vendor dashboard screenshot with sample data
Facts were read from the linked pages on November 2, 2026. Figures are as reported by each source; vendor and survey claims are labeled as such and nothing is estimated. If a page here is out of date, tell us and we will correct it from a source.