What are the key sales KPIs for the Commercial Diagnostic Imaging Equipment industry in 2027?
The sales KPIs that matter most in commercial diagnostic imaging equipment are orders and the order backlog, book-to-bill, the split between equipment revenue and service revenue, the profit margin on the imaging business, and the regional mix, with China shown on its own. A scanner is sold once but is serviced for years, so imaging companies watch what has been ordered, what has been delivered and what keeps paying afterward. This page uses only figures read in the most recent releases and reports. GE HealthCare reported a book-to-bill of 1.03 times and a backlog of $23.7 billion for the third quarter of 2026. Siemens Healthineers reported an equipment book-to-bill of 1.15 for its fourth quarter and Imaging comparable revenue growth of 10.0%. Philips said Diagnosis & Treatment order intake growth approached 20% while the segment's comparable sales were flat.
No company read here publishes rep quota attainment, win rate, sales-cycle length or the size of its installed base of scanners, so none is given. GE HealthCare reports in U.S. dollars and Siemens Healthineers and Philips in euros, and each defines its terms differently, so compare each KPI over time within one company, not across companies. This is business content about sales metrics, not medical or financial advice. For the wider device market, see sales KPIs for commercial medical device sales.
Orders and backlog: what has been sold but not yet delivered
Imaging equipment is ordered well before it is installed, so orders and backlog are the first forward-looking KPIs. A sales team controls them more directly than revenue, which depends on installation schedules.
- GE HealthCare, total orders, Q3 2026 (company-reported, company level, U.S. dollars)Organic orders growth of 4.0%, book-to-bill of 1.03 times and backlog of $23.7 billion.
- GE HealthCare, backlog, Q3 2026 (CFO statement on the earnings call)Backlog of $23.7 billion, up $2.5 billion or 12% year over year.
- Philips, Diagnosis & Treatment, Q3 2026 (CEO statement on the earnings call, euros)Order intake growth approached 20%, with both Image-Guided Therapy and Precision Diagnosis delivering double-digit order growth; the equipment order book increased both sequentially and year-on-year.
- Philips, group, Q3 2026 (company-reported)Comparable order intake increased by 8%, driven by strong Diagnosis & Treatment.
Read the scope carefully. GE's orders and backlog cover the whole company, not only imaging, while Philips gives its order growth for the Diagnosis & Treatment segment, which includes imaging and image-guided therapy. A sales leader should track orders by modality, such as CT, MR and ultrasound, because the public figures do not break them out.
Book-to-bill: the ratio behind the backlog
Book-to-bill divides orders by revenue in a period. GE defines it as total orders divided by total revenues. A ratio above one means orders are arriving faster than revenue is being recognized, so the backlog is growing. Companies do not all publish it for the same business.
- GE HealthCare, Q3 2026 (company-reported)Book-to-bill of 1.03 times for the total company.
- Siemens Healthineers, fiscal Q4 2026, July to September (company-reported)Very good equipment book-to-bill ratio of 1.15.
- Siemens Healthineers, fiscal year 2026 (company-reported)Equipment book-to-bill ratio of 1.14.
- Philips, Q3 2026No book-to-bill ratio was given in the quarterly report or on the call.
Two companies publish a ratio and the third does not, so a table of ratios side by side would mislead. The Siemens figure is for equipment across the group, not Imaging alone, and the GE figure covers all of GE HealthCare. That limit is the main reason to keep your own ratio by product line.
Equipment versus service revenue
Selling a scanner starts a relationship that continues through service, upgrades and software. That is why the split between equipment and service revenue is a core KPI, even where companies disclose it only in passing.
- GE HealthCare, sales of products, Q3 2026 (company-reported, U.S. dollars)$3,602 million versus $3,375 million a year earlier.
- GE HealthCare, sales of services, Q3 2026 (company-reported)$1,911 million versus $1,769 million a year earlier.
- GE HealthCare, nine months 2026 (company-reported)Products $10,364 million versus $9,755 million; services $5,575 million versus $5,172 million.
- GE HealthCare, growth, Q3 2026 (CFO statement on the earnings call)Strong performance in both product and service revenues, at 6.7% and 8.1% growth, respectively.
These are company-wide totals, because the release does not give service revenue for the imaging segment alone. The pattern is still useful: the service line grew faster than the product line in the quarter. That reading is mine, drawn from the company's own growth rates.
Installed base and recurring revenue
The installed base is the stock of systems already at customer sites. It drives service contracts, upgrades and replacement orders, so imaging sales teams treat every installed system as a future sales lead. The companies read here do not publish a scanner count.
- GE HealthCare, installed base (CFO statement on the earnings call)Referred to a huge installed base and a deep relationship with customers; no installed-base size was given.
- Philips, installed base (CEO statement on the earnings call)Vendor of choice positions at major U.S. health systems open an opportunity to capture market share and expand its installed base.
- Philips, Enterprise Monitoring as a Service, Q3 2026 (CFO statement)Revenues nearly doubling year-on-year, which the CFO described as building more recurring and predictable revenue.
Monitoring is not imaging, but the model shows the direction: subscription-style revenue is being pushed alongside one-time equipment sales. No company read here published a recurring-revenue share for imaging, so that KPI belongs in your own reporting.
Segment growth and margin
Revenue growth and margin show whether the imaging business is paying for itself. Each company defines its segments differently, and the periods and currencies differ, so these figures are read one company at a time.
- GE HealthCare, Advanced Imaging Solutions, Q3 2026 (company-reported, U.S. dollars)Segment revenues $3,873 million, up 6.1% with 4.5% organic growth; segment EBIT margin 15.3%, up 130 bps.
- Siemens Healthineers, Imaging, fiscal Q4 2026 (company-reported, euros)Comparable revenue growth of 10.0%; adjusted EBIT margin of 21.9%.
- Philips, Diagnosis & Treatment, Q3 2026 (company-reported, euros)Sales of EUR 2,085 million; comparable sales growth was flat; adjusted EBITA margin 12.3%, up 50 basis points.
Philips explained the flat quarter: growth in Image Guided Therapy was offset by a decline in Precision Diagnosis, mainly because of the phasing of ultrasound sales and lower sales in China. A strong order quarter and flat sales in the same segment is a reminder that orders lead revenue.
Regional mix and China
Imaging demand differs by region, and China has moved differently from the rest of the world. Companies disclose regions at different levels, and some are for the whole company.
- Philips, Diagnosis & Treatment, Q3 2026 (company-reported)Mature geographies showed low-single-digit growth, offset by a mid-single-digit decline in Growth geographies.
- Philips, China and North America (CEO and CFO statements on the earnings call)China order intake grew, helped by timing of the renewal program and a weaker prior-year comparison, and China sales are expected to be broadly stable; North America was particularly strong as health systems consolidate.
- GE HealthCare, China, Q3 2026 (CEO statement on the earnings call)7% growth in the quarter, a majority of it still driven by foreign exchange.
The practical KPI is imaging orders and revenue with China shown separately, plus a view of whether growth comes from price, volume or currency. GE's own comment that most of its China growth was currency shows why.
Pricing, tariffs and outlook
Tariffs and procurement rules affect what a scanner costs and when a hospital buys. The companies disclose little about price per system, but they do discuss the environment.
- GE HealthCare, tariffs, Q3 2026 (earnings call)Tariffs and tariff expense were down year over year in the quarter.
- GE HealthCare, 2026 guidance (company-reported)Organic revenue growth of approximately 4.0%, raised from 3.0% to 4.0%.
- Philips, 2026 outlook (company-reported)Full-year 2026 outlook reiterated.
Guidance is a company view, not a sales KPI, but it frames the target a sales team is working against.
What is not published
A scorecard to start with
Read together, the reports point to a compact scorecard. This structure is my judgment, built on the KPIs the companies themselves report.
- Orders. New orders by modality, such as CT, MR and ultrasound.
- Backlog. What is priced and scheduled, and what is at risk of delay.
- Book-to-bill. Orders divided by revenue, by product line.
- Equipment versus service. Revenue from each, tracked together.
- Installed base. Systems at customer sites and their service coverage.
- Margin. Reported next to growth, not apart from it.
- Regional mix. With China, North America and Europe shown separately.
- Price and mix. Price realization and the share of newer systems in orders.
Questions people ask
What are the most important sales KPIs for diagnostic imaging equipment?
Orders and backlog, book-to-bill, equipment versus service revenue, segment margin and regional mix. Companies publish orders, growth and margin well, and installed-base counts and win rates not at all.
What book-to-bill do imaging companies report?
GE HealthCare reported 1.03 times for the total company in the third quarter of 2026. Siemens Healthineers reported an equipment book-to-bill of 1.15 for its fourth quarter and 1.14 for fiscal 2026. Philips gave no ratio. Scopes and definitions differ.
How big is GE HealthCare's backlog?
GE HealthCare reported a backlog of $23.7 billion at the end of the third quarter of 2026, up $2.5 billion or 12% year over year, according to its CFO on the earnings call. That figure covers the whole company, not imaging alone.
Why does service revenue matter in imaging sales?
Equipment is sold once and then serviced for years. GE HealthCare reported sales of services of $1,911 million in the third quarter and said service revenue grew 8.1%. Those are company-wide figures, not imaging alone.
How is China affecting imaging sales KPIs?
Philips cited lower China sales in Precision Diagnosis, and Philips also said China order intake grew. GE HealthCare said China grew 7%, mostly from foreign exchange. Track China separately.
Can these figures be compared across GE HealthCare, Siemens Healthineers and Philips?
Not directly. GE reports in U.S. dollars, Siemens Healthineers and Philips in euros, and each defines segments, orders and adjusted profit differently. Compare each KPI over time within one company.
Sources
- GE HealthCare: third quarter 2026 results, October 28, 2026 (SEC 8-K exhibit) · Orders, book-to-bill, backlog, segment results, products and services sales, guidance
- GE HealthCare: Q3 2026 earnings call transcript (Motley Fool) · Backlog growth, product and service growth, China, tariffs, installed base
- Siemens Healthineers: press release on fiscal year 2026, November 5, 2026 · Equipment book-to-bill, Imaging growth and margin, fiscal 2027 outlook
- Siemens Healthineers: Q4 results coverage (Investing.com) · Quarter revenue, Imaging growth, book-to-bill
- Philips: quarterly report Q3 2026, November 3, 2026 (PDF) · Order intake, Diagnosis & Treatment sales, margin, geographies, outlook
- Philips: Q3 2026 earnings call transcript (Motley Fool) · Diagnosis & Treatment orders, order book, North America, China, recurring revenue
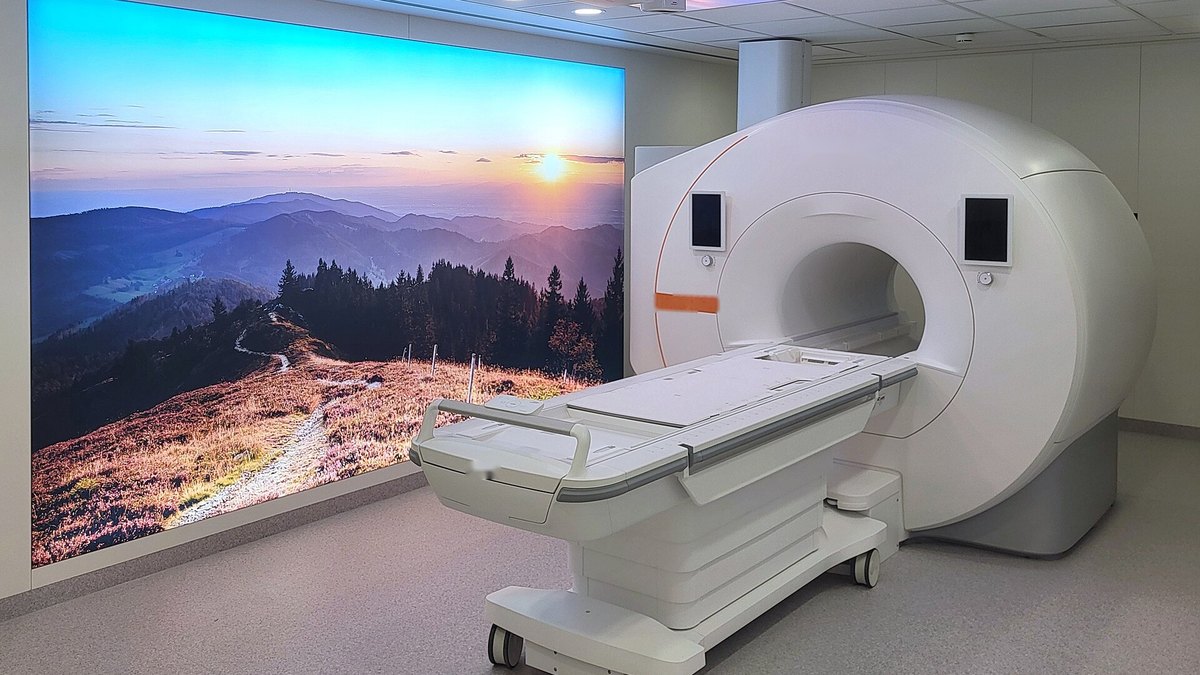
- Photo: Clinical 1.5T MRI system.jpg by FbrG, CC BY-SA 4.0, Wikimedia Commons (small equipment lettering retouched out) · Hero photo
Figures were read from the linked company releases, a Philips quarterly report and earnings call transcripts on November 7, 2026. They are company-reported for the periods stated, in each company's own currency, and some come from third-party transcripts that may contain errors. Where no figure was published, the page says so instead of estimating. Hero photo: FbrG, CC BY-SA 4.0, via Wikimedia Commons. This page is about sales metrics and is not medical or financial advice.
Top photo: FbrG / CC BY-SA 4.0 via Wikimedia Commons